PDF Page 1
Draft
AI in Search Reduces Publisher Referrals Without Improving User
Experience: Experimental Evidence
Stephanie T. Wang1,†,∗, Jeffrey Gleason2,†, Yakov Bart3, Christo Wilson2, Dana´e Metaxa1
1Computer and Information Science, University of Pennsylvania, Pennsylvania, United States 2Khoury College of Computer Sciences, Northeastern University, Massachusetts, United States 3D’Amore-McKim School of Business, Northeastern University, Massachusetts, United States
†These authors contributed equally to this work. ∗Corresponding author: stephtw@engineering.upenn.edu
Abstract
The integration of generative AI into web search delivers synthesized answers to user queries, changing how people navigate and assess information, while raising concerns about the downstream impacts on publishers who supply the underlying content. We conduct a preregistered field experiment (N=1,100) on Google Search, the dominant online search platform, to estimate the causal effects of AI Overviews and AI Mode on user behavior, perceptions, and publisher traffic. We show that removing AI Overviews and AI Mode increases click-through rates to publishers, while an AI Mode-only experience reduces click-through rates and erodes user experience and trust in information found on Google. These findings show that integrating generative AI into web search reshapes online attention, with economic consequences for the online publishers that sustain both search platforms and the overall information ecosystem.
Keywords: generative AI, search engines, information ecosystems, human-AI interaction
Significance statement. Generative AI is fundamentally changing search and how billions of people access information online. In a preregistered randomized controlled trial with participants using Google Search in their everyday browsing, we find that removing AI features in Google Search increases clicks to third-party publishers, while Google’s conversational AI search reduces clicks and worsens user experience. Our findings show how integrating generative AI into search can reshape how users engage with the broader web, providing more information directly in search while reducing engagement with external sources, with implications for the economic sustainability of online publishers.
1 Introduction
Google Search has come a long way since its early days as a list of “ten blue links.” In May 2024, Google introduced AI Overviews (AIO), which use large language models (LLMs) to synthesize sources and generate summary answers to search queries directly on the results page [1]. One year later, Google launched AI Mode, a conversational search experience powered by Gemini that generates direct AI responses to queries and supports multi-turn, follow-up questions [2].
1
arXiv:2608.18352v1 [cs.IR] 18 Aug 2026
PDF Page 2
Draft
The design of the search engine results page (SERP) matters because it shapes how users assess the credibility of information sources [3] and distributes clicks and attention between third-party publishers and Google’s own properties [4, 5]. The introduction of AI into search has raised these stakes and increasingly strained the relationship between Google and third-party publishers: publishers view AIO and AI Mode as substitutes for their content and report falling referral traffic from Google Search [6, 7, 8, 9]. Google disputes these claims, arguing that AI features are complements that have kept overall referral traffic steady, improved click quality, and expanded opportunities for websites to be surfaced through longer, more complex queries [10]. On the other hand, users may benefit from the convenience of having their questions answered directly on the search results page in what is known as “good abandonment” [11, 12], creating a three-way tension in which user convenience, publisher sustainability, and Google’s consolidation of informational authority do not easily align.
This dynamic of AI substituting for third-party content is not unique to search. Beyond search specifically, generative AI summaries have been shown to substitute for engagement with particular third-party publishers: ChatGPT’s release coincided with significant declines in Stack Overflow visits and questions, particularly for topics ChatGPT excels at and with no corresponding drop in post quality, suggesting genuine displacement rather than a culling of low-quality content [13, 14], while Wikipedia articles overlapping with ChatGPT’s content saw similar declines in editing and viewership [15].
Observational studies about the effect of LLM adoption on search activity and engagement with online sources more broadly have found mixed effects. Some find substitution, where LLM use replaces traditional web search, leading to a net decrease in search activity and downstream web traffic [16]. Others find complementarity, where LLM use augments rather than displaces traditional search, increasing the number of websites visited and occurring alongside rather than instead of traditional search [17]. Evidence on AI features embedded directly in search remains comparatively scarce: one study finds that AIOs reduced English Wikipedia traffic by 15% [18], with findings consistent with substitution being strongest when short answers satisfy users’ informational intent. AI Mode, Google’s fully conversational search experience, remains understudied despite representing the most significant departure yet from traditional Google Search design.
A related body of work examines the properties of generative search outputs themselves and their effects on users. Generative search outputs answer queries with fluency and a sense of credibility, yet reduce transparency and sourcing ability [19, 20]. These systems produce consequential errors in high-stakes domains [21, 22], exhibit systematic source-selection biases [23, 24, 25], and reduce hedging language, making responses appear more informative and confident than their sources warrant [25, 26, 27]. These properties of generative search have motivated studies examining downstream effects on user trust [28], belief formation [29, 30], and general satisfaction [31, 32]. An RCT found that users trust GenAI search answers less than traditional search; notably, citations increased trust even when hallucinated, while uncertainty highlighting reduced it [28]. This tracks with a separate finding that users prefer responses with more citations regardless of their credibility [33]. The incongruence between model confidence and source credibility has motivated experiments on uncertainty-highlighting interventions, which reduce over-reliance on incorrect responses [34, 35, 31]. AI summaries have been shown to affect attitudes and behavioral intentions [29], and AI search can increase selective exposure and reinforce pre-existing beliefs [30]. LLM-based search has also been found to increase overall satisfaction with the search experience [31, 32].
2
PDF Page 3
Draft
Research Questions and Hypotheses
Existing work documents meaningful consequences of generative AI in search for users, publishers, and platforms, but relies primarily on observational data and controlled laboratory experiments. How, and to what extent, generative AI in search shapes user behavior, perceptions, and publisher traffic in naturalistic, real-world settings remains an open question. In particular, it is unclear whether AI in search primarily facilitates users’ discovery of third-party publishers or increasingly substitutes for it. To address this gap, we conduct a preregistered field experiment [36] in which participants are randomly assigned to one of three conditions via a browser extension [37, 38, 39] that manipulates the availability of AI in search features [40] and captures behavioral and attitudinal outcomes: 1) No AI Search, which hides AI Overviews and AI Mode; 2) Current Search, which makes no changes; and 3) AI Mode Search, which redirects all searches to AI Mode.
We preregistered three primary hypotheses (H1–H3) and four secondary hypotheses (H4–H7), each predicting an effect of AI Mode Search and No AI Search relative to Current Search. Our first three hypotheses focus on outcomes with direct relevance to users, publishers, and Google:
Hypothesis 1. AI Mode Search will decrease overall trust in responses relative to Current Search, while No AI Search will increase it. This prediction builds on prior work documenting reduced trust in AI-generated search responses [28].
Hypothesis 2. AI Mode Search will decrease click-through rate to external sites relative to Current Search, while No AI Search will increase it. This prediction is motivated by publisher reports of declining referral traffic [6] and observational data on AI Overviews [8].
Hypothesis 3. AI Mode Search will increase the number of search sessions relative to Current Search, while No AI Search will decrease it. This prediction is based on Google’s own public claims that AI features increase search engagement [10].
Beyond these primary outcomes, we examine four secondary hypotheses related to user experience and search behavior:
Hypothesis 4. AI Mode Search will increase perceptions of responses as personalized and relevant relative to Current Search, while No AI Search will decrease these perceptions, motivated by Google’s own claims about AI-driven personalization [41]. In the context of news-related search, AI Mode Search will decrease preference for and trust in AI Mode relative to Current Search, while No AI Search will have no impact on these outcomes. We did not have directional priors for how AI Mode Search and No AI Search affect satisfaction with, usefulness of, and agency over search responses, relative to Current Search.
Hypothesis 5. AI Mode Search will decrease total outbound clicks, clicks to news sites, Wikipedia [18] and Reddit, and ads relative to Current Search, while No AI Search will increase these outcomes.
Hypothesis 6. AI Mode Search will increase minutes per session and the fraction of questionform searches relative to Current Search, while No AI Search will decrease them. We did not have a directional prior for how AI Mode Search and No AI Search affect the number of searches per session, relative to Current Search.
3
PDF Page 4
Draft
Hypothesis 7. AI Mode Search will increase substitution to other search engines (Bing, DuckDuckGo, Yahoo) relative to Current Search, while No AI Search will have no impact on substitution.
2 Experimental Methods and Data
We recruited participants from two channels: research recruitment platform Prolific, and Northeastern students enrolled in a work-study program with one of the authors. Participants were recruited in waves between March 17 and March 19, 2026. We limited recruitment to US-based participants, and screened for individuals who (1) were 18 years or older, (2) used Google Chrome as their primary browser, and (3) used Google Search as their primary search engine. After giving informed consent, participants completed a pre-survey (Section S7.2) that elicited their familiarity with and sentiment towards LLM applications, as well as perceived trust, usefulness, satisfaction, agency, and personalization/relevance of information-seeking on Google. Participants then installed our browser extension and experienced three days of the baseline, Current Search condition. This period allowed us to measure pre-treatment versions of behavioral outcomes like search sessions per day and click-through rate.
After three days, participants were randomly assigned to one of our three search conditions: (1) No AI Search, (2) Current Search, or (3) AI Mode Search. The No AI condition hid Google’s AI Overviews, including those at the top of the results page, in the middle of the results page, and nested within People Also Ask components. AI Mode searches were also redirected to general search. The Current Search condition made no modifications to Google Search: AI Overviews may be present and AI Mode is accessible. The AI Mode condition redirected all searches to AI Mode. Participants experienced their assigned conditions for seven days. At the end of the seven-day period, we sent participants a post-survey that asked about perceptions of information-seeking on Google (Section S7.3) and presented head-to-head comparisons of AI Mode and Current Search responses in the context of news queries (Figure S1).
Our preregistration specified a target sample size of 1,200 participants, based on power analyses conducted using data from a pilot experiment [36]. To reach this target, a total of 1,444 participants (1,387 from Prolific and 57 from Northeastern) were enrolled, each completing the pre-survey and installing our browser extension. Of these, N = 1, 100 made at least one search during the 7-day experiment period and were invited to take the post-experiment survey. A total of N = 956 participants completed the post-experiment survey, 343 of whom were in the No AI Search condition, 304 in Current Search, and 309 in AI Mode Search. Treatment groups and the control group were balanced across covariates, and there was no evidence of differential attrition across the three conditions (Section S5). Following our pre-registration, treatment effects on behavioral outcomes are estimated among participants eligible for the post-experiment survey (N = 1, 100). Treatment effects on survey outcomes are estimated among participants who completed the survey (N = 956).
Prolific participants received $10 upon completing the study and Northeastern work-study students were paid $17 per hour. The analysis sample (i.e., participants who qualified for the postsurvey) skewed younger (75% under 45), highly educated (87% with at least some college), and left-leaning (58% Democrat vs. 20% Republican). Race and ethnicity and gender distributions were similar to the US Census [42]. 50% of participants identified as women, 48% as men, and 2% as another gender. Participants were predominantly white (68%), followed by Black or African American (14%), Hispanic or Latino (11%), and Southeast or East Asian (11%). Race and ethnicity was multiple-choice. During the baseline period, participants averaged 9.2 searches per day (sd =
4
PDF Page 5
Draft
14.3), 4.0 search sessions per day (sd = 4.7), and 4.1 clicks per day (sd = 7.0). The SI Appendix (Section S6.1) describes how we grouped searches into sessions, and validates that results are robust to different definitions. We observed that 36% of searches triggered AI Overviews (Figure S3) and participants used AI Mode for 0.6% of their searches (Figure S7).
3 Results
This section presents our findings about the impacts of AI search features on user behaviors and user perceptions. For each outcome variable, we first describe the impact of AI Mode Search and then the impact of No AI Search.
Each result is labeled with its corresponding pre-registered [36] hypothesis. The section ends with a qualitative exploration of open-ended feedback from participants in our AI Mode condition.
Compliance and Attrition
During the experiment period, 94.7% of searches in the AI Mode group were successfully routed to AI Mode. In the No AI condition, 90% of AI Overviews were successfully hidden on the first intervention day, but the success rate declined to 0% as the experiment progressed (Figure S4). The cause of this breakdown was a change to AI Overview HTML rolled out by Google during the study period that broke our extension’s logic for identifying and hiding AI Overviews. Overall, 51.1% of AI Overviews were successfully hidden and the median participant in this condition had 50% of AI Overviews hidden (Figure S5). Our pre-registration specified that we would report local average treatment effect (LATE) estimates in the case of non-compliance. In the No AI Search condition, we measure compliance as the fraction of AI Overviews that were successfully hidden for each participant. In the AI Mode Search condition, we measure compliance as the fraction of searches that were routed to AI Mode.
A related concern for causal interpretation is differential attrition across conditions: if assignment to AI Mode caused higher participant attrition than other conditions, our AI Mode estimates would reflect a selected subsample rather than the full randomized population, and would be better treated as descriptive than causal. We do not find evidence of this in our study: survey noncompletion (36.6% vs. 32.3 – 32.5% in the other conditions, p = 0.292) and zero-search attrition (26.5% vs. 20.7 – 24.0%, p = 0.109) were both directionally higher but not statistically significant in the AI Mode group (Section S5.3).
Throughout the rest of this section, we reference intent-to-treat (ITT) effects when discussing AI Mode Search (i.e., “assignment to AI Mode”) and local average treatment effects (LATEs) when discussing No AI Search (“exposure to No AI”). The corresponding figures and tables show both estimates. Each result is labeled with its corresponding pre-registered hypothesis.
Effects on User Behaviors
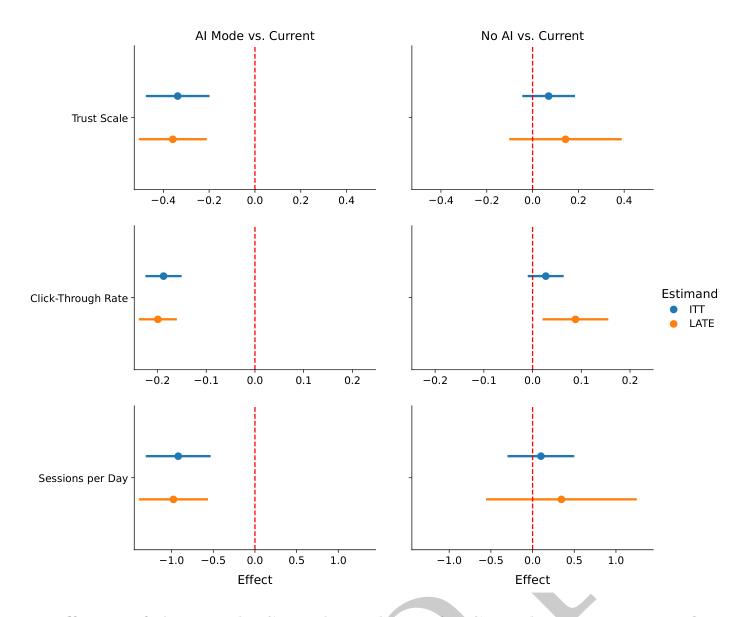
Click-Through Rate (H2). Assignment to AI Mode Search significantly reduced click-through rate by -18.8 percentage points (pp) [95% CI: -22.2pp, -15.3pp; p < 0.001], consistent with H2a (Figure 1 and Table S1). Conversely, exposure to No AI Search increased click-through rate by 8.8pp [95% CI: 2.3pp, 15.3pp; p = 0.008], consistent with H2b. Our pre-registered robustness check analyzing click-through rate at the search-level also shows a positive impact of No AI Search (Figure S8, top panel).
5
PDF Page 6
Draft
0.4 0.2 0.0 0.2 0.4
Trust Scale
AI Mode vs. Current
0.4 0.2 0.0 0.2 0.4
No AI vs. Current
0.2 0.1 0.0 0.1 0.2
Click-Through Rate
0.2 0.1 0.0 0.1 0.2
1.0 0.5 0.0 0.5 1.0
Effect
Sessions per Day
1.0 0.5 0.0 0.5 1.0
Effect
Estimand
ITT LATE
Figure 1: Effects of AI Mode Search and No AI Search on Primary Outcomes.
Search Sessions per Day (H3) Assignment to AI Mode Search significantly reduced search sessions per day by -0.92 sessions [95% CI: -1.30, -0.55; p < 0.001], contrary to H3a, which predicted an increase. We do not find evidence that exposure to No AI Search impacted search sessions per day [95% CI: -0.55, 1.24; p = 0.175], failing to support H3b.
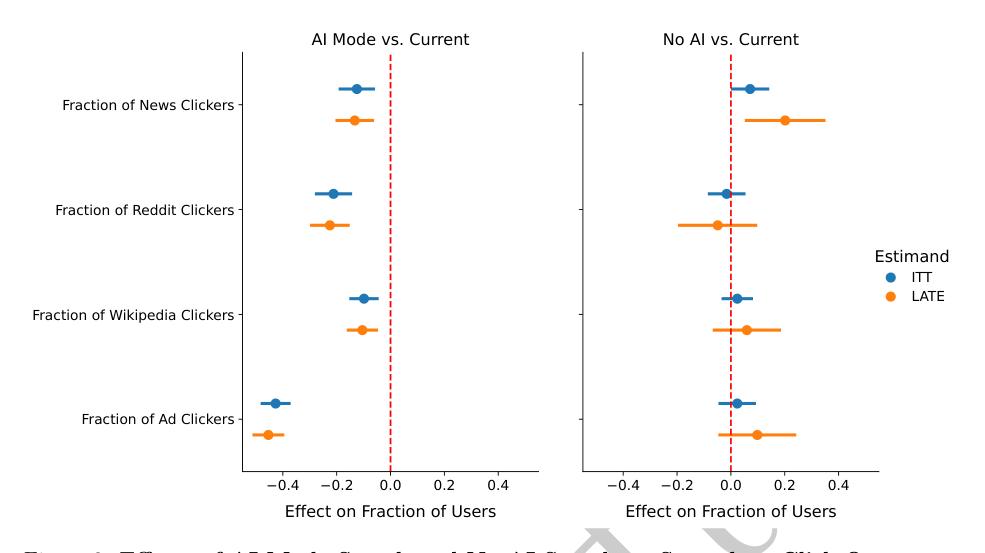
Clicks to Specific Domains (H5) Assignment to AI Mode Search significantly reduced the fraction of users clicking through to news sites (-12.5pp [95% CI: -18.7, -6.3; p < 0.001]), Reddit (-21.2pp [95% CI: -27.5, -14.8; p < 0.001]), Wikipedia (-9.9pp [95% CI: -14.7, -5.0; p < 0.001]). The fraction of users clicking on ads decreased by -42.7pp because AI Mode did not surface ads at the time of our experiment. These results are consistent with H5a (Figure 2 and Table S2), and are robust to using clicks per day instead of fraction of users clicking (Figure S9) and to an alternative classification of news domains (Table S10). In partial support of H5b, exposure to No AI Search increased the fraction of users clicking through to news sites, though we find no evidence of impacts on Reddit, Wikipedia, or ad clicks; the news-site effect is not robust to using clicks per day or an alternative domain classification.
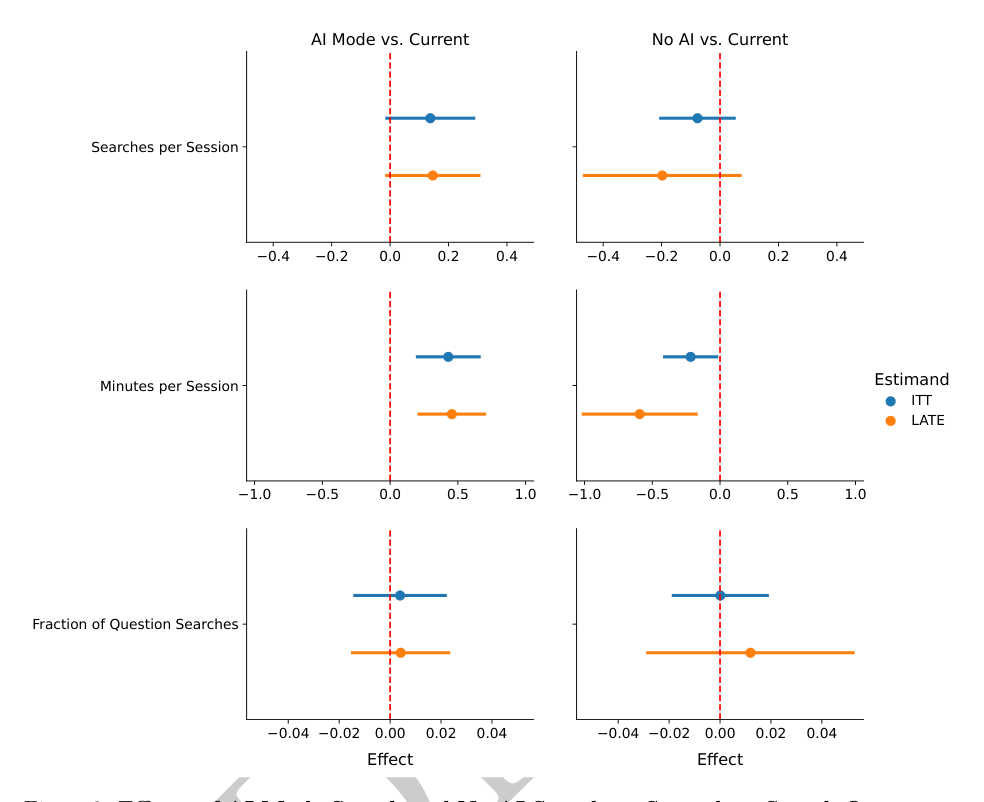
Session Characteristics (H6) Assignment to AI Mode Search significantly increased minutes per session by 0.43 minutes [95% CI: 0.20, 0.66; p = 0.001], consistent with H6a (Figure 3 and Table S3). This is corroborated by our session-level robustness check (Figure S10, left panel). We do not find evidence of impacts on searches per session (H6c) or the fraction of queries with question words (i.e., “who”, “what”, “where”, “why”, “when”, or “how”; H6a). Exposure to No AI Search decreased minutes per session by -0.59 minutes [95% CI: -1.01, -0.18; p = 0.015], consistent with H6b; the session-level estimate is directionally consistent but not statistically significant. We find
6
PDF Page 7
Draft
0.4 0.2 0.0 0.2 0.4
Effect on Fraction of Users
Fraction of News Clickers
Fraction of Reddit Clickers
Fraction of Wikipedia Clickers
Fraction of Ad Clickers
AI Mode vs. Current
0.4 0.2 0.0 0.2 0.4
Effect on Fraction of Users
No AI vs. Current
Estimand
ITT LATE
Figure 2: Effects of AI Mode Search and No AI Search on Secondary Click Outcomes. Effects on Clicks per Day not shown because other click outcomes are on the same, interpretable scale.
no evidence of impacts of No AI Search on searches per session (H6d) or question-form queries (H6b).
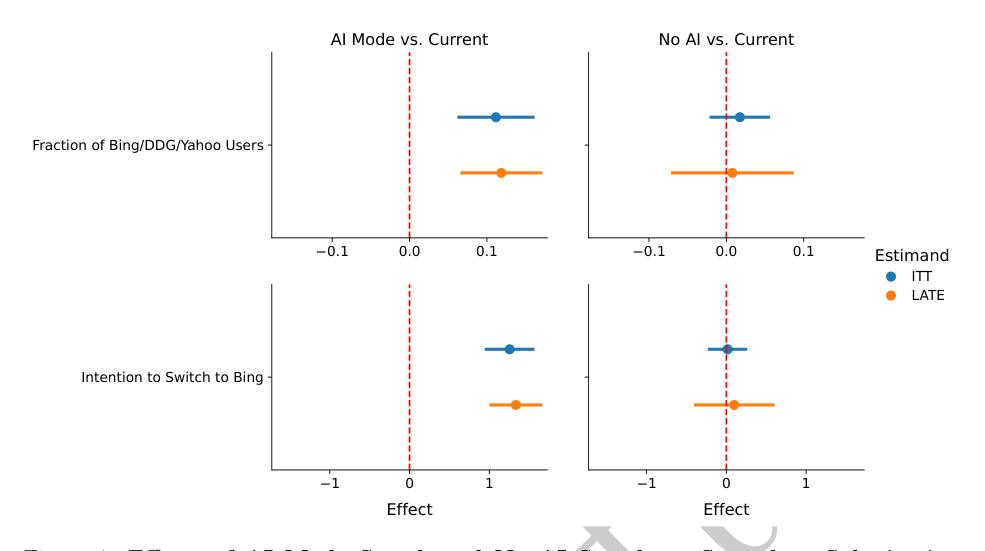
Search Engine Substitution (H7) Assignment to AI Mode Search significantly increased the fraction of users searching on a competitor engine (Bing, DuckDuckGo, or Yahoo) by 11.2pp [95% CI: 6.4, 16.0; p < 0.001] and intention to switch to Bing by 1.25 points on a 7-point scale [95% CI: 0.96, 1.55; p < 0.001], consistent with H7a (Figure 4 and Table S4). Consistent with H7b, we do not find evidence that exposure to No AI Search impacted substitution to competitor engines or long-term intention to switch.
Effects on User Perceptions
Trust (H1) Assignment to AI Mode Search significantly decreased trust in information on Google by -0.34 points on a 7-point scale [95% CI: -0.47, -0.20; p < 0.001], consistent with H1a (Figure 1 and Table S1). We do not find evidence that exposure to No AI Search impacted trust [95% CI: -0.10, 0.38; p = 0.107], failing to support H1b.
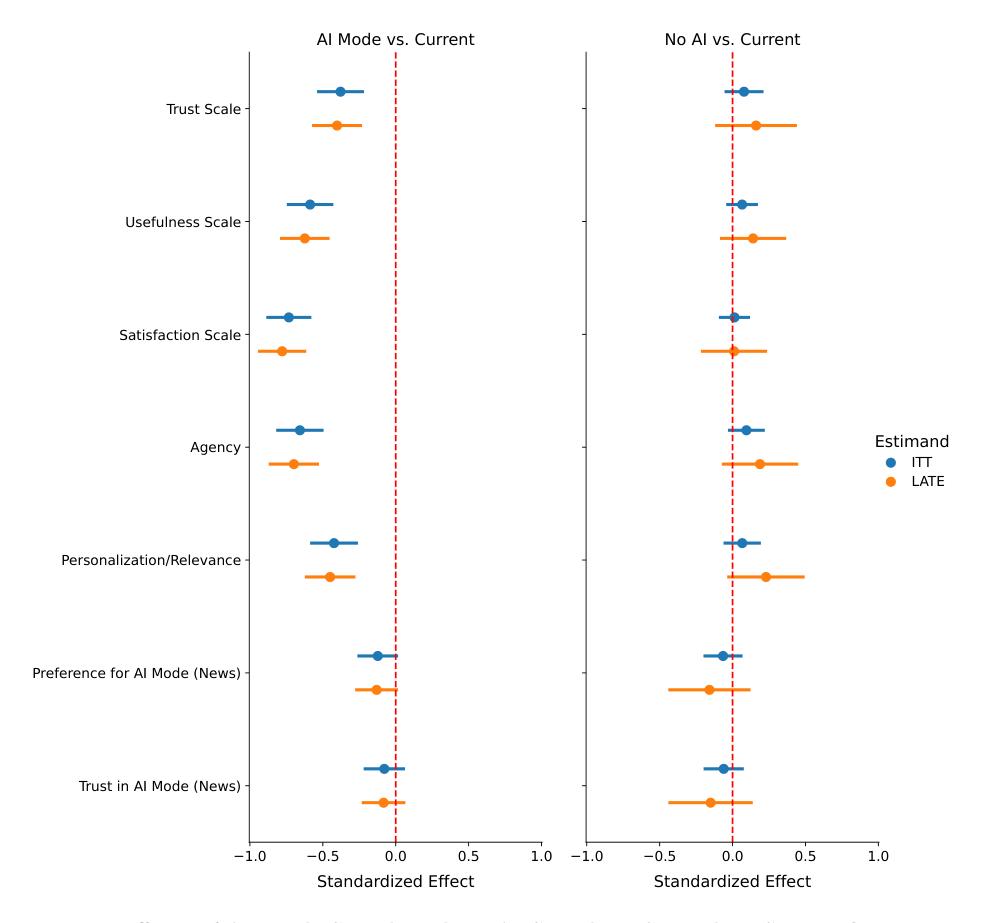
Satisfaction, Usefulness, and Agency (H4) Assignment to AI Mode Search significantly reduced perceived usefulness (-0.59 sd [95% CI: -0.74, -0.44; p < 0.001]), satisfaction (-0.73 sd [95% CI: -0.88, -0.59; p < 0.001]), and agency (-0.66 sd [95% CI: -0.81, -0.51; p < 0.001]), resolving H4a in the direction of negative perceptions of AI Mode Search (Figure 5 and Table S5). We do not find evidence that exposure to No AI Search impacted any of these outcomes (H4b).
7
PDF Page 8
Draft
−0.4 −0.2 0.0 0.2 0.4
Searches per Session
AI Mode vs. Current
−0.4 −0.2 0.0 0.2 0.4
No AI vs. Current
−1.0 −0.5 0.0 0.5 1.0
Minutes per Session
−1.0 −0.5 0.0 0.5 1.0
−0.04 −0.02 0.00 0.02 0.04
Effect
Fraction of Question Searches
−0.04 −0.02 0.00 0.02 0.04
Effect
Estimand
ITT LATE
Figure 3: Effects of AI Mode Search and No AI Search on Secondary Search Outcomes.
Personalization and Relevance (H4) Assignment to AI Mode Search significantly decreased perceived personalization/relevance of responses by -0.42 sd [95% CI: -0.58, -0.27; p < 0.001], contrary to H4c, which predicted an increase. We do not find evidence that exposure to No AI Search impacted this outcome, failing to support H4d.
News Context (H4) We do not find evidence that assignment to AI Mode Search significantly impacted preference for AI Mode in the head-to-head news comparison [95% CI: -0.25, 0.01; p = 0.102] or trust in AI Mode in the news context [95% CI: -0.21, 0.05; p = 0.241], only partially supporting H4e. Consistent with H4f, exposure to No AI Search had no detectable impact on these outcomes.
Heterogeneous Treatment Effects
We test for heterogeneous effects on our primary outcomes across two pre-registered moderators: (1) pre-treatment familiarity with LLMs and (2) pre-treatment number of Google Search sessions. After correcting for multiple comparisons, only one moderator-outcome pair is significant: AI Mode reduces the number of sessions per day (H3) significantly more for heavy Google users (i.e., more
8
PDF Page 9
Draft
0.1 0.0 0.1
Fraction of Bing/DDG/Yahoo Users
AI Mode vs. Current
0.1 0.0 0.1
No AI vs. Current
1 0 1
Effect
Intention to Switch to Bing
1 0 1
Effect
Estimand
ITT LATE
Figure 4: Effects of AI Mode Search and No AI Search on Secondary Substitution Outcomes.
than 4 daily sessions) (estimate = -2.01 sessions per day, p = 0.005).
Qualitative Feedback about AI Mode
At the end of the study, in the post-experiment survey, participants in the AI Mode condition responded to the open-ended question: “What was your overall impression of Google’s AI Mode after one week of using it?”. We qualitatively coded each response (N=309), assigning each response 1–4 codes to describe its theme. We developed codes inductively, continuing until saturation was reached at 17 distinct codes across six dimensions: overall sentiment, search preference, usability, information quality, trust and credibility, and autonomy and control.
Expressed sentiment towards AI Mode was heterogeneous, with negative responses predominating (33.6%, n = 103), followed by positive (29.3%, n = 90); mixed responses, in which participants expressed both favorable and unfavorable views, comprised 13.7% of responses (n = 42).
Specific codes point to several drivers of negative experience. Usability issues were prominent: participants expressed a loss of control and user agency (17.6%, n = 54); as one participant noted, “I like to choose when I use AI”. Difficulty navigating to specific websites was also common (15.3%, n = 47) with one participant describing how, “when I just wanted to land on the webpage I would type in, it would tell me about the website instead”. Limited links and/or source diversity was noted in 13.4% of responses (n = 41). Participants also noted that AI outputs were too verbose (6.2%, n = 19; e.g., “it gives way too much info for easy searches”) and raised hallucination and accuracy concerns (4.6%, n = 14; e.g., “the AI mode provided a lot of inaccurate and inconsistent information”). An explicit preference for traditional search, and UI bugs also appeared but less frequently.
Positive experiences included efficiency and time saving (14.0%, n = 43; e.g., “the AI does a strong job of pulling exactly what I was looking for, saving time”) and faithful summarization
9
PDF Page 10
Draft
1.0 0.5 0.0 0.5 1.0
Standardized Effect
Trust Scale
Usefulness Scale
Satisfaction Scale
Agency
Personalization/Relevance
Preference for AI Mode (News)
Trust in AI Mode (News)
AI Mode vs. Current
1.0 0.5 0.0 0.5 1.0
Standardized Effect
No AI vs. Current
Estimand
ITT LATE
Figure 5: Effects of AI Mode Search and No AI Search on Secondary Survey Outcomes. Trust Scale shown for reference. Effects are presented in standardized units because some scales have 7 points (trust, agency, and personalization/relevance), some scales have 5 points (usefulness, satisfaction), and some questions are binary (news comparisons).
10
PDF Page 11
Draft
(6.2%, n = 19). Fewer participants expressed trust in AI results (1.6%, n=5), a preference for AI summarization over traditional search (1.6%, n = 5), or adaptation to AI Mode over time (3.6%, n = 11; e.g., “at first the AI Mode threw me off, but I got used to it quickly”).
4 Discussion
Our study provides causal evidence about the effects of integrating generative AI into web search. Leveraging an in-situ browser experiment that manipulated users’ access to AI Overviews and AI Mode in Google Search over a 10-day study period, we show that the current trajectory of AImediated search presents a clear tradeoff: as Google increasingly answers users’ questions directly, referral traffic to the broader web declines substantially, yet these changes do not currently yield commensurate improvements in users’ trust or overall search experience.
At the time of our study, AI Overviews had already become a standard component of Google Search. Removing AI Overviews increased external click-through by 8.8 percentage points, with suggestive evidence of even greater referral traffic to news publishers.
Looking ahead, Google positions AI Mode as the future of search, and its effects on traffic were greater and broader across domains: relative to standard Google Search, enforcing AI Mode reduced external click-through by 18.8 percentage points, reduced daily search sessions, and reduced the fraction of users clicking through to news sites, Reddit, and Wikipedia alike (H5a). Notably, AI Mode increased minutes per session even as it reduced click-through and search sessions per day, showing users spent more time within the AI-mediated search experience while visiting the broader web less often. This reduction in search sessions was significantly larger among heavy Google users.
Our findings about impacts on click-through rates are consistent with publisher-reported traffic declines since AI features launched [6, 8] and observational evidence that AI Overviews reduced Wikipedia traffic by 15% [18], and our experimental estimates suggest the impact generalizes well beyond Wikipedia and news. Taken together, these results suggest that AI Mode’s design, at least as implemented at the time of our study, may compound the traffic pressures of AI Overviews that we document here and that publishers have separately reported, with direct consequences for revenue models, including advertising models [43], that are dependent on traffic.
Despite these significant effects on traffic, we find few corresponding gains for users. Removing AI Overviews produced no detectable change in perceived trust in information found on Google, nor on measures of search experience, suggesting that benefits of AI Overviews are not reflected in these outcomes. AI Mode’s effects, relative to current Google Search, decreased perceived trust in information on Google, usefulness, satisfaction, agency and relevance, and increased substitution to competing search engines. Qualitative responses help explain these effects: although some participants appreciated faster access to answers, they more frequently described feeling less in control of their search process, encountered difficulty in reaching desired sites, and saw fewer and less diverse sources. Taken together, these results suggest that in its current form, conversational AI search is viewed less favorably by both publishers and searchers.
Our estimates reflect an early snapshot of Google’s AI Mode: at the time of our study, AI Mode did not yet surface ads or rely on other traditional ad-revenue mechanisms. How Google chooses to monetize AI Mode will be worth monitoring, particularly given the publisher dynamics we document. As they inevitably do so — through advertising, sponsored results, or other mechanisms — we anticipate user satisfaction and other measures will shift away from this pre-monetization baseline.
Our results also point to a tension for Google. AI Mode is designed to help Google compete with other AI chatbot products like ChatGPT for the growing share of queries handled through
11
PDF Page 12
Draft
conversational interfaces [44], which also serves Google’s interest in keeping users on its site. Yet many users remain unconvinced. Our findings showed that AI Mode drove significant substitution toward competing search engines (an 11.2% increase in competitor search use, H7a), along with substantial intent among these users to switch to Bing if AI Mode were required over the longer term. If users remain firm in their mistrust and dislike of AI Mode, Google will face a tension between pushing the product on users (to acclimate them as much as for its other benefits), and risking alienation that could cost it ground to competitors in a search market that today is nearly monopolistic.
Importantly, the introduction of AI features in search shift Google away from serving as an intermediary that connects users to external sources (the canonical definition of a search engine) and into a destination for answers unto itself. This shift already carries regulatory consequences: a recent German court ruling held that Google’s AI Overviews cause it to function as a content provider rather than a neutral intermediary, on the grounds that “AI-produced summaries amounted to the company’s own content rather than a mere display of third-party information” [45]. This determination turns on the same distinction to which our results speak: whether AI in search primarily facilitates users’ discovery of third-party publishers, or increasingly substitutes for it.
Given these implications, high stakes for Google, publishers, and users alike, we argue that AI-mediated search should be evaluated not only in terms of the quality of answers generated, but also in terms of how these systems reshape the relationship between users, publishers, and the broader web—from the sustainability of publishers, to Google’s status as an intermediary, to users’ own right to control their discovery, evaluation, and engagement with with information.
Limitations Our study has several limitations, which also point to areas for future work. Compliance in the No AI Search condition degraded over the study period due to a Google interface change, falling to roughly 50% overall. Therefore, we report LATE estimates (Section 3), which rely on the assumption that assignment only affected outcomes through AI Overview exposure (i.e., the exclusion restriction). If the interface change altered participants’ experience more broadly, that assumption may not hold.
We do not find evidence of differential attrition by condition, which supports treating our AI Mode estimates as causal rather than descriptive (Section 3); we note, however, that this does not rule out the possibility that unfamiliarity with the interface affected participant behavior in other ways.
Our sample was recruited from Prolific and a university work-study program, and skewed younger, more highly educated, and more left-leaning than the general US population (Figure S2); effects may differ in magnitude or direction in a more representative sample.
Our experiment spanned seven days of treatment exposure, which allows us to detect shortterm behavioral and attitudinal shifts but not longer-run adaptation—it is possible that some effects would attenuate, or that new ones would emerge, over a longer exposure period; future work should examine the impacts of longer-term adjustment on behavior and beliefs. Baseline AI Mode usage was minimal (0.6% of searches) prior to our intervention, meaning our AI Mode condition reflects a forced, full-adoption scenario rather than the gradual, opt-in uptake most users would experience in practice; effects of organic AI Mode adoption may differ from the effects of the enforced assignment we study here.
Our design intentionally measured effects across the distribution of real-world search tasks; future work should measure effects for specific high-stakes contexts and search tasks (e.g., health, legal, or financial information-seeking), where the consequences of reduced trust or click-through may differ. Finally, we were not powered to detect small effects on secondary click and search
12
PDF Page 13
Draft
outcomes, and null effects on these outcomes should not be interpreted as evidence of no effect. The same caution applies to secondary survey outcomes, which have fairly wide confidence intervals.
5 Acknowledgments
We thank David Lazer, Emma Lurie, and Ro Encarnaci´on for helpful feedback and discussions. We thank all of our pilot and full study participants.
Generative AI (GPT-5.5-mini) was used to lightly edit and rephrase author-written text for clarity and fluency. All analyses, interpretations, and conclusions were developed and verified by the authors.
6 Competing interest
The authors declare that they have no competing interests.
7 Funding
This work was supported in part by the National Science Foundation under award IIS-2442711. J.G. was supported by the Platforms for Exchange and Allocation of Resources (PEAR) program, a National Science Foundation Research Traineeship.
8 Author contributions
Conceptualization: S.W., J.G., Y.B., C.W., D.M., Methodology: S.W., J.G., Y.B., C.W., D.M., Software: S.W., J.G., Validation: S.W., J.G., Formal analysis: S.W., J.G., Investigation: S.W., J.G., Resources: S.W., J.G., Data curation: S.W., J.G., Writing - original draft: S.W., J.G.; Writing - review & editing: S.W., J.G., Y.B., C.W., D.M.; Supervision: Y.B., C.W., D.M.; Project administration: S.W., J.G.; Funding acquisition: S.W., J.G., Y.B., C.W., D.M.
9 Data availability
The repository with aggregated data and code necessary to reproduce the results in this paper are available on Harvard Dataverse [46]. The preregistration of the study is available on OSF [36].
10 Ethics statement
The study was approved by the Institutional Review Boards of both participating universities. All participants provided informed consent prior to installing the browser extension and enrolling in the study. Consent materials outlined the types of data to be collected and stated that participants might experience modifications to their Google Search interface during the study period. Participants were informed that browsing history and HTML snapshots of Google Search result pages would be collected solely for research purposes, stored securely, accessible only to the research team, and anonymized prior to analysis. Participation was entirely voluntary. Participants could withdraw consent, discontinue participation, or request deletion of their data at any time.
To protect participant privacy, we stripped all collected data of identifiers where possible. However, because browsing data lacks a fixed structure, it is not possible to systematically remove all
13
PDF Page 14
Draft
identifying information; collected URLs may contain embedded identifiers, and HTML snapshots may include personal details such as names or email addresses appearing in dynamic locations. Given these limitations, raw browsing data and HTML snapshots will not be publicly released.
At the conclusion of the study, participants were financially compensated through the recruitment platform and debriefed via a statement shown in the web app after submitting the post-survey. The debriefing explained the study’s purpose, details about the three conditions, and the rationale for withholding this information from participants in order to minimize demand effects.
References
[1] Elizabeth Reid. Generative AI in Search: Let Google do the searching for you, May 2024.
[2] Robby Stein. Expanding AI Overviews and introducing AI Mode, March 2025.
[3] Emma Lurie and Eni Mustafaraj. Investigating the Effects of Google’s Search Engine Result
Page in Evaluating the Credibility of Online News Sources. In Proceedings of the 10th ACM Conference on Web Science, pages 107–116, Amsterdam Netherlands, May 2018. ACM.
[4] Jeffrey Gleason, Desheng Hu, Ronald E. Robertson, and Christo Wilson. Google the Gate-
keeper: How Search Components Affect Clicks and Attention. Proceedings of the International AAAI Conference on Web and Social Media, 17:245–256, June 2023.
[5] Louis-Daniel Pape and Michelangelo Rossi. Is Competition Only One Click Away? The Digital
Markets Act’s Impact on Google Maps. Marketing Science, 45(3):596–613, May 2026.
[6] Isabella Simonetti and Katherine Blunt. News Sites Are Getting Crushed by Google’s New AI
Tools. Wall Street Journal, June 2025.
[7] Suzanne Bearne. Publishers fear AI summaries are hitting online traffic, 2025.
[8] Athena Chapekis and Anna Lieb. Google users are less likely to click on links when an ai
summary appears in the results. Pew Research Center, July 2025. Accessed: 2026-05-11.
[9] Kate Conger. Google Is Building an A.I. Fence Around the Internet It Once Championed. The
New York Times, July 2026.
[10] Liz Reid. AI in Search is driving more queries and higher quality clicks, August 2025.
[11] Abdigani Diriye, Ryen White, Georg Buscher, and Susan Dumais. Leaving so soon?: under-
standing and predicting web search abandonment rationales. In Proceedings of the 21st ACM international conference on Information and knowledge management, pages 1025–1034, Maui Hawaii USA, October 2012. ACM.
[12] Jane Li, Scott Huffman, and Akihito Tokuda. Good abandonment in mobile and PC internet
search. In Proceedings of the 32nd international ACM SIGIR conference on Research and development in information retrieval, pages 43–50, Boston MA USA, July 2009. ACM.
[13] Gordon Burtch, Dokyun Lee, and Zhichen Chen. The consequences of generative AI for online
knowledge communities. Scientific Reports, 14(1):10413, May 2024.
14
PDF Page 15
Draft
[14] R Maria del Rio-Chanona, Nadzeya Laurentsyeva, and Johannes Wachs. Large language models reduce public knowledge sharing on online Q&A platforms. PNAS Nexus, 3(9):pgae400, September 2024. eprint: https://academic.oup.com/pnasnexus/articlepdf/3/9/pgae400/59316621/pgae400.pdf.
[15] Liang Lyu, James Siderius, Hannah Li, Daron Acemoglu, Daniel Huttenlocher, and Asuman
Ozdaglar. Wikipedia contributions in the wake of chatgpt. In Companion Proceedings of the ACM on Web Conference 2025, pages 1176–1179, 2025.
[16] Nicolas Padilla, H. Tai Lam, Anja Lambrecht, and Brett Hollenbeck. The Impact of LLM
Adoption on Online User Behavior, December 2025.
[17] Samira Gholami, Cristiana Firullo, Cristobal Cheyre, and Alessandro Acquisti. Beyond search:
Llm adoption and web traffic concentration. Available at SSRN 6238578, 2026.
[18] Mehrzad Khosravi and Hema Yoganarasimhan. Impact of ai search summaries on website
traffic: Evidence from google ai overviews and wikipedia. Available at SSRN 6164926, 2026.
[19] Shahan Ali Memon and Jevin D. West. Search Engines Post-ChatGPT: How Generative Artificial Intelligence Could Make Search Less Reliable, February 2024. arXiv:2402.11707 [cs].
[20] Chirag Shah and Emily M. Bender. Envisioning Information Access Systems: What Makes
for Good Tools and a Healthy Web? ACM Trans. Web, 18(3):33:1–33:24, April 2024.
[21] Desheng Hu, Joachim Baumann, Aleksandra Urman, Elsa Lichtenegger, Robin Forsberg, Anik´o
Hann´ak, and Christo Wilson. Auditing Google’s AI Overviews and Featured Snippets: A Case Study on Baby Care and Pregnancy. Proceedings of the International AAAI Conference on Web and Social Media, 20(1):1044–1062, May 2026.
[22] Rhiannon Williams. Why Google’s AI Overviews gets things wrong, May 2024.
[23] Mahe Chen, Xiaoxuan Wang, Kaiwen Chen, and Nick Koudas. Generative Engine Optimiza-
tion: How to Dominate AI Search, September 2025. arXiv:2509.08919 [cs].
[24] Kai-Cheng Yang. News Source Citing Patterns in AI Search Systems, July 2025. arXiv:2507.05301 [cs].
[25] Michelle Huang, Agam Goyal, Koustuv Saha, and Eshwar Chandrasekharan. Answer bubbles:
Information exposure in ai-mediated search. arXiv preprint arXiv:2603.16138, 2026.
[26] Nelson F Liu, Tianyi Zhang, and Percy Liang. Evaluating verifiability in generative search
engines. In Findings of the Association for Computational Linguistics: EMNLP 2023, pages 7001–7025, 2023.
[27] Pranav Narayanan Venkit, Philippe Laban, Yilun Zhou, Yixin Mao, and Chien-Sheng Wu.
Search Engines in the AI Era: A Qualitative Understanding to the False Promise of Factual and Verifiable Source-Cited Responses in LLM-based Search. In Proceedings of the 2025 ACM Conference on Fairness, Accountability, and Transparency, pages 1325–1340, Athens Greece, June 2025. ACM.
[28] Haiwen Li and Sinan Aral. Human Trust in AI Search: A Large-Scale Experiment, April 2025.
arXiv:2504.06435 [cs].
15
PDF Page 16
Draft
[29] Yiwei Xu, Saloni Dash, Sungha Kang, Wang Liao, and Emma S. Spiro. AI summaries in online
search influence users’ attitudes, 2025. Version Number: 2.
[30] Nikhil Sharma, Q. Vera Liao, and Ziang Xiao. Generative Echo Chamber? Effect of LLM-
Powered Search Systems on Diverse Information Seeking. In Proceedings of the CHI Conference on Human Factors in Computing Systems, pages 1–17, Honolulu HI USA, May 2024. ACM.
[31] Sofia Eleni Spatharioti, David Rothschild, Daniel G Goldstein, and Jake M Hofman. Effects of
LLM-based Search on Decision Making: Speed, Accuracy, and Overreliance. In Proceedings of the 2025 CHI Conference on Human Factors in Computing Systems, pages 1–15, Yokohama Japan, April 2025. ACM.
[32] Ruiyun Xu, Yue Feng, and Hailiang Chen. ChatGPT vs. Google: A Comparative Study of
Search Performance and User Experience, July 2023. arXiv:2307.01135 [cs].
[33] Mihran Miroyan, Tsung-Han Wu, Logan King, Tianle Li, Jiayi Pan, Xinyan Hu, Wei-Lin
Chiang, Anastasios Angelopoulos, Narges Norouzi, Joseph E Gonzalez, et al. Search arena: Analyzing search-augmented llms. In International Conference on Learning Representations, volume 2026, pages 41109–41146, 2026.
[34] Sunnie S. Y. Kim, Q. Vera Liao, Mihaela Vorvoreanu, Stephanie Ballard, and Jennifer Wort-
man Vaughan. ”I’m Not Sure, But...”: Examining the Impact of Large Language Models’ Uncertainty Expression on User Reliance and Trust. In Proceedings of the 2024 ACM Conference on Fairness, Accountability, and Transparency, FAccT ’24, pages 822–835, New York, NY, USA, June 2024. Association for Computing Machinery.
[35] Sunnie S. Y. Kim, Jennifer Wortman Vaughan, Q. Vera Liao, Tania Lombrozo, and Olga
Russakovsky. Fostering Appropriate Reliance on Large Language Models: The Role of Explanations, Sources, and Inconsistencies. In Proceedings of the 2025 CHI Conference on Human Factors in Computing Systems, CHI ’25, pages 1–19, New York, NY, USA, April 2025. Association for Computing Machinery.
[36] Anonymous. Impact of ai-driven search on user behaviors and perceptions, 2026.
[37] Stephanie Wang, Shengchun Huang, Alvin Zhou, and Dana¨e Metaxa. Lower Quantity, Higher Quality: Auditing News Content and User Perceptions on Twitter/X Algorithmic versus Chronological Timelines. Proceedings of the ACM on Human-Computer Interaction, 8(CSCW2):1–25, November 2024.
[38] Michelle S. Lam, Ayush Pandit, Colin H. Kalicki, Rachit Gupta, Poonam Sahoo, and
Dana¨e Metaxa. Sociotechnical Audits: Broadening the Algorithm Auditing Lens to Investigate Targeted Advertising. Proceedings of the ACM on Human-Computer Interaction, 7(CSCW2):360:1–360:37, October 2023.
[39] Tiziano Piccardi, Martin Saveski, Chenyan Jia, Jeffrey Hancock, Jeanne L Tsai, and Michael S
Bernstein. Reranking partisan animosity in algorithmic social media feeds alters affective polarization. Science, 390(6776):eadu5584, 2025.
[40] Google. AI in Search. https://search.google/ai-in-search/, 2026.
[41] Google. Connect your Google content apps to get a Search experience that’s tailored to you.
Google Search Help Center. Accessed: 2026-05-11.
16
PDF Page 17
Draft
[42] U.S. Census Bureau QuickFacts: United States.
[43] Karsten Weide. How AI Search Threatens Publishers and AdTech Vendors, Sep 2025.
[44] Jeffrey Gottfried, William Bishop, Monica Anderson, Michelle Faverio, Eugenie Park, and
Colleen McClain. Americans and AI 2026: Chatbots, Smart Devices and Views on Impact, June 2026. Section: Artificial Intelligence.
[45] German media regulator says Google’s AI Overviews subject to German media law. Reuters,
July 2026.
[46] Jeffrey Gleason, Stephanie Wang, Yakov Bart, Christo Wilson, and Dana´e Metaxa. Replication
Data for: “AI in Search Reduces Traffic to Publishers Without Improving Searcher Experience: A Field Experiment”, 2026.
[47] Andrew J Flanagin and Miriam J Metzger. Perceptions of internet information credibility.
Journalism & mass communication quarterly, 77(3):515–540, 2000.
[48] Jinke D Van Der Laan, Adriaan Heino, and Dick De Waard. A simple procedure for the assessment of acceptance of advanced transport telematics. Transportation Research Part C: Emerging Technologies, 5(1):1–10, 1997.
[49] Kai-Cheng Yang. A list of news domains, March 2025.
[50] Google. Google click identifier (GCLID): Definition. Google Ads Help. Accessed: 2026-05-11.
[51] Michael L Anderson. Multiple inference and gender differences in the effects of early interven-
tion: A reevaluation of the abecedarian, perry preschool, and early training projects. Journal of the American statistical Association, 103(484):1481–1495, 2008.
[52] Winston Lin, Donald P. Green, and Alexander Coppock. Standard operating procedures for
Don Green’s lab at Columbia. Technical report, June 2016. Version 1.05.
17
PDF Page 18
Draft
Supplementary Materials
This document provides supplementary methods, tables, and figures accompanying the main manuscript. Tables and figures are numbered with an “S” prefix (e.g., Table S1, Fig. S1) to distinguish them from those in the main text.
S1 Full Results: Main Text Tables
The tables in this section are results referenced in the main manuscript’s Results section.
Table S1. Treatment Effect Estimates for Primary Outcomes.
Outcome Comparison Estimand N Estimate SE 95% CI p p adjusted
Trust Scale AI Mode vs. Current ITT 613 -0.337 0.068 [-0.471, -0.203] <0.001 <0.001 Trust Scale AI Mode vs. Current LATE 613 -0.359 0.073 [-0.502, -0.215] <0.001 <0.001 Trust Scale No AI vs. Current ITT 647 0.070 0.056 [-0.040, 0.180] 0.211 0.145 Trust Scale No AI vs. Current LATE 541 0.144 0.122 [-0.097, 0.384] 0.241 0.107 Click-Through Rate AI Mode vs. Current ITT 714 -0.188 0.018 [-0.222, -0.153] <0.001 <0.001 Click-Through Rate AI Mode vs. Current LATE 714 -0.199 0.019 [-0.236, -0.163] <0.001 <0.001 Click-Through Rate No AI vs. Current ITT 742 0.027 0.018 [-0.007, 0.062] 0.124 0.103 Click-Through Rate No AI vs. Current LATE 615 0.088 0.033 [0.023, 0.153] 0.008 0.006 Sessions per Day AI Mode vs. Current ITT 714 -0.920 0.192 [-1.296, -0.545] <0.001 <0.001 Sessions per Day AI Mode vs. Current LATE 714 -0.978 0.204 [-1.379, -0.577] <0.001 <0.001 Sessions per Day No AI vs. Current ITT 742 0.100 0.197 [-0.287, 0.487] 0.612 0.257 Sessions per Day No AI vs. Current LATE 615 0.345 0.453 [-0.545, 1.236] 0.446 0.175
Table S2. Treatment Effect Estimates for Secondary Click Outcomes.
Outcome Comparison Estimand N Estimate SE 95% CI p p adjusted
Clicks per Day AI Mode vs. Current ITT 714 -2.273 0.257 [-2.777, -1.770] <0.001 <0.001 Clicks per Day AI Mode vs. Current LATE 714 -2.415 0.275 [-2.954, -1.876] <0.001 <0.001 Clicks per Day No AI vs. Current ITT 742 0.386 0.277 [-0.157, 0.929] 0.163 0.100 Clicks per Day No AI vs. Current LATE 615 1.072 0.641 [-0.186, 2.330] 0.095 0.044 Fraction of News Clickers AI Mode vs. Current ITT 714 -0.125 0.032 [-0.187, -0.063] <0.001 <0.001 Fraction of News Clickers AI Mode vs. Current LATE 714 -0.133 0.034 [-0.199, -0.067] <0.001 <0.001 Fraction of News Clickers No AI vs. Current ITT 742 0.071 0.033 [0.006, 0.137] 0.033 0.029 Fraction of News Clickers No AI vs. Current LATE 615 0.202 0.073 [0.058, 0.346] 0.006 0.005 Fraction of Reddit Clickers AI Mode vs. Current ITT 714 -0.212 0.032 [-0.275, -0.148] <0.001 <0.001 Fraction of Reddit Clickers AI Mode vs. Current LATE 714 -0.225 0.035 [-0.293, -0.157] <0.001 <0.001 Fraction of Reddit Clickers No AI vs. Current ITT 742 -0.016 0.033 [-0.080, 0.049] 0.633 0.267 Fraction of Reddit Clickers No AI vs. Current LATE 615 -0.049 0.072 [-0.190, 0.092] 0.495 0.145 Fraction of Wikipedia Clickers AI Mode vs. Current ITT 714 -0.099 0.025 [-0.147, -0.050] <0.001 <0.001 Fraction of Wikipedia Clickers AI Mode vs. Current LATE 714 -0.105 0.027 [-0.157, -0.053] <0.001 <0.001 Fraction of Wikipedia Clickers No AI vs. Current ITT 742 0.024 0.027 [-0.029, 0.076] 0.376 0.185 Fraction of Wikipedia Clickers No AI vs. Current LATE 615 0.059 0.062 [-0.062, 0.180] 0.336 0.139 Fraction of Ad Clickers AI Mode vs. Current ITT 714 -0.427 0.026 [-0.477, -0.377] <0.001 <0.001 Fraction of Ad Clickers AI Mode vs. Current LATE 714 -0.454 0.027 [-0.507, -0.400] <0.001 <0.001 Fraction of Ad Clickers No AI vs. Current ITT 742 0.024 0.033 [-0.040, 0.088] 0.470 0.206 Fraction of Ad Clickers No AI vs. Current LATE 615 0.098 0.071 [-0.041, 0.237] 0.166 0.071
18
PDF Page 19
Draft
Table S3. Treatment Effect Estimates for Secondary Search Outcomes.
Outcome Comparison Estimand N Estimate SE 95% CI p p adjusted
Searches per Session AI Mode vs. Current ITT 714 0.138 0.076 [-0.011, 0.286] 0.070 0.096 Searches per Session AI Mode vs. Current LATE 714 0.146 0.080 [-0.012, 0.304] 0.070 0.095 Searches per Session No AI vs. Current ITT 742 -0.077 0.064 [-0.203, 0.049] 0.229 0.224 Searches per Session No AI vs. Current LATE 615 -0.198 0.136 [-0.464, 0.069] 0.146 0.162 Minutes per Session AI Mode vs. Current ITT 714 0.429 0.116 [0.201, 0.657] <0.001 0.001 Minutes per Session AI Mode vs. Current LATE 714 0.456 0.123 [0.214, 0.697] <0.001 0.001 Minutes per Session No AI vs. Current ITT 742 -0.217 0.098 [-0.409, -0.025] 0.027 0.057 Minutes per Session No AI vs. Current LATE 615 -0.593 0.212 [-1.009, -0.176] 0.005 0.011 Fraction of Question Searches AI Mode vs. Current ITT 714 0.004 0.009 [-0.014, 0.022] 0.667 0.578 Fraction of Question Searches AI Mode vs. Current LATE 714 0.004 0.010 [-0.015, 0.023] 0.667 0.333 Fraction of Question Searches No AI vs. Current ITT 742 0.000 0.009 [-0.018, 0.019] 0.990 0.591 Fraction of Question Searches No AI vs. Current LATE 615 0.012 0.021 [-0.028, 0.052] 0.561 0.317
Table S4. Treatment Effect Estimates for Secondary Substitution Outcomes.
Outcome Comparison Estimand N Estimate SE 95% CI p p adjusted
Fraction of Bing/DDG/Yahoo Users AI Mode vs. Current ITT 714 0.112 0.024 [0.064, 0.160] <0.001 <0.001 Fraction of Bing/DDG/Yahoo Users AI Mode vs. Current LATE 714 0.119 0.026 [0.068, 0.170] <0.001 <0.001 Fraction of Bing/DDG/Yahoo Users No AI vs. Current ITT 742 0.017 0.019 [-0.020, 0.055] 0.357 0.312 Fraction of Bing/DDG/Yahoo Users No AI vs. Current LATE 615 0.008 0.039 [-0.070, 0.085] 0.843 0.728 Intention to Switch to Bing AI Mode vs. Current ITT 613 1.254 0.149 [0.962, 1.546] <0.001 <0.001 Intention to Switch to Bing AI Mode vs. Current LATE 613 1.333 0.159 [1.022, 1.645] <0.001 <0.001 Intention to Switch to Bing No AI vs. Current ITT 647 0.015 0.115 [-0.211, 0.240] 0.897 0.814 Intention to Switch to Bing No AI vs. Current LATE 541 0.098 0.247 [-0.388, 0.583] 0.692 0.728
Table S5. Treatment Effect Estimates for Secondary Survey Outcomes. Effects are presented in standardized units.
Outcome Comparison Estimand N Estimate SE 95% CI p p adjusted
Usefulness Scale AI Mode vs. Current ITT 613 -0.587 0.076 [-0.736, -0.438] <0.001 <0.001 Usefulness Scale AI Mode vs. Current LATE 613 -0.624 0.081 [-0.783, -0.464] <0.001 <0.001 Usefulness Scale No AI vs. Current ITT 647 0.065 0.050 [-0.033, 0.164] 0.191 0.230 Usefulness Scale No AI vs. Current LATE 541 0.141 0.110 [-0.076, 0.357] 0.203 0.184 Satisfaction Scale AI Mode vs. Current ITT 613 -0.733 0.073 [-0.877, -0.589] <0.001 <0.001 Satisfaction Scale AI Mode vs. Current LATE 613 -0.779 0.079 [-0.933, -0.624] <0.001 <0.001 Satisfaction Scale No AI vs. Current ITT 647 0.013 0.049 [-0.083, 0.110] 0.789 0.487 Satisfaction Scale No AI vs. Current LATE 541 0.010 0.110 [-0.206, 0.227] 0.926 0.419 Agency AI Mode vs. Current ITT 613 -0.657 0.078 [-0.809, -0.505] <0.001 <0.001 Agency AI Mode vs. Current LATE 613 -0.699 0.082 [-0.860, -0.537] <0.001 <0.001 Agency No AI vs. Current ITT 647 0.095 0.059 [-0.021, 0.211] 0.108 0.161 Agency No AI vs. Current LATE 541 0.188 0.128 [-0.063, 0.439] 0.141 0.165 Personalization/Relevance AI Mode vs. Current ITT 613 -0.423 0.078 [-0.576, -0.270] <0.001 <0.001 Personalization/Relevance AI Mode vs. Current LATE 613 -0.450 0.083 [-0.613, -0.287] <0.001 <0.001 Personalization/Relevance No AI vs. Current ITT 647 0.066 0.060 [-0.051, 0.184] 0.269 0.243 Personalization/Relevance No AI vs. Current LATE 541 0.229 0.130 [-0.026, 0.484] 0.078 0.111 Preference for AI Mode (News) AI Mode vs. Current ITT 1836 -0.123 0.066 [-0.252, 0.006] 0.061 0.102 Preference for AI Mode (News) AI Mode vs. Current LATE 1836 -0.131 0.070 [-0.268, 0.006] 0.060 0.099 Preference for AI Mode (News) No AI vs. Current ITT 1938 -0.065 0.063 [-0.189, 0.058] 0.301 0.251 Preference for AI Mode (News) No AI vs. Current LATE 1623 -0.158 0.139 [-0.430, 0.113] 0.253 0.184 Trust in AI Mode (News) AI Mode vs. Current ITT 1836 -0.078 0.067 [-0.209, 0.053] 0.243 0.241 Trust in AI Mode (News) AI Mode vs. Current LATE 1836 -0.083 0.071 [-0.222, 0.056] 0.241 0.184 Trust in AI Mode (News) No AI vs. Current ITT 1938 -0.061 0.065 [-0.188, 0.067] 0.351 0.275 Trust in AI Mode (News) No AI vs. Current LATE 1623 -0.151 0.142 [-0.429, 0.128] 0.289 0.184
19
PDF Page 20
Draft
S2 Materials and Methods
S2.1 Participant Recruitment
We recruited participants from two channels: Prolific and Northeastern students enrolled in a workstudy program with one of the authors. Participants were recruited in waves between March 17 and March 19, 2026. We limited recruitment to US-based participants, and screened for individuals who (1) were 18 years or older, (2) used Google Chrome as their primary browser, and (3) used Google Search as their primary search engine. After giving informed consent, participants completed a pre-experiment survey which elicited their familiarity with and sentiment towards LLM applications, as well as perceived trust, usefulness, satisfaction, agency, and personalization/relevance of information-seeking on Google. Participants then installed our browser extension. Prolific participants were compensated $2 for completing the screening, pre-experiment survey and installing the browser extension, and $8 for finishing the study. Northeastern students were paid $17 per hour through their work-study program.
S2.2 Interventions
Our study implemented three search conditions via a Chromium browser extension:
1. No AI Search: Hides Google’s AI Overviews, including those at the top of the results page, in the middle of the results page, and nested within People Also Ask components. AI Mode searches are redirected to general search at the network level. The “AI Mode” tab on the Google Search page is hidden. The “AI Mode” prompt on the Google home page is hidden. Unfortunately, browser extensions cannot hide the “AI Mode” prompt in the Chrome browser’s address bar.
2. Current Search: No interventions are applied, so this is the default experience of Google Search. AI Overviews may be present, AI Mode is accessible, and “AI Mode” tabs/prompts are visible.
3. AI Mode Search: All Google searches are redirected to AI Mode at the network level. The “All” and “Web” tabs on the Google search page are hidden, which direct to general search and web results, respectively. Search verticals (e.g., news, shopping, images) are still accessible.
S2.3 Experimental Platform
We developed a custom experimental platform that enabled us to collect participants’ web browsing behavior, deploy custom surveys, and make in-situ changes to their Google Search experience.
Browser extension The browser extension handles enforcing the three Google Search conditions and logging browsing activity, HTML snapshots of no AI, Current and AI Mode results, and click events that originate from Google Search, Gemini and ChatGPT. The extension is compatible with all Chromium-derived browsers, including Google Chrome, and is published on the Chrome Web Store (https://chromewebstore.google.com/detail/cedfhkdnooeicfiaheamppdckbidiaah). The extension manages enforcing the conditions by injecting a content script into Google Search pages, which detected and modified the rendered DOM in real time. Participants were randomly assigned to one of three conditions managed through a field stored in the extension’s local storage. Upon each Google Search page load, the extension retrieved this assignment and applied the corresponding
20
PDF Page 21
Draft
intervention. In the No AI Search condition, the extension continuously monitored DOM mutations via a MutationObserver. When an AI Overview container was detected, its CSS ‘display’ property was set to ‘none’. The ‘AI Mode’ search tab was similarly hidden to prevent participants from navigating to it. In the AI Mode condition, the extension suppressed the default ‘All’ and ‘Web’ search tabs, and redirected all Google searches to AI Mode at the network level (i.e., URL parameter udm=50). Participants in this condition received a one-time disclosure modal on their first exposure to AI Mode, informing them that they would be using AI-driven search for the study duration. The Current Search condition received no DOM modifications. The extension passively recorded participants’ interactions across Google Search, Google AI Mode, Google Gemini and ChatGPT. On Google Search pages, the extension captured the full HTML of the results page, along with the AI Overview container. On AI Mode, Gemini and ChatGPT, a MutationObserver tracked each AI response, capturing HTML and the sequential conversational turn order. Across all platforms, outbound link clicks were logged.
Web application The study’s web application was built with Django and deployed on a server hosted by Northeastern University, backed by a PostgreSQL database. The application managed participant onboarding, accounts, condition assignment, survey administration, and data collection from the browser extension. Upon enrollment, participants were directed to the web application and guided through an onboarding flow: providing informed consent, authenticating via Google social auth using their Prolific or other email address, completing a demographic survey and pre-survey, installing the browser extension from the Chrome Web Store, and verifying the extension was active before beginning the study. During the study period, the extension communicated with the web application via dedicated endpoints to store scraped data, retrieve condition assignments, and manage authenticated sessions. All communication occurred over HTTPS, with scraped HTML, click events, and URLs stored in the database for later analysis. At the conclusion of the study period, participants were directed to the web application via a URL sent to their Prolific inbox or email to complete the post-survey.
S2.4 Outcome Measures
Primary Outcome Measures
• Trust. We measure trust in Google responses using a validated 5-item scale [47] that has been used in recent work evaluating AI search [28]. The five items are: “Over the last 7 days, how [believable / trustworthy / accurate / biased / complete] was the information you found searching on Google?” Each item is measured on a 7-point Likert scale (not at all to extremely). The bias item is reverse-coded.
• Click-Through Rate. The total number of external clicks originating from Google divided by the total number of Google searches. The numerator excludes clicks to google.com (e.g., follow-up searches). The denominator excludes searches on Google’s vertical search pages (e.g., images, news, shopping). Each turn of a conversation in AI Mode is counted as a separate search. This is a user-level metric.
• Search Sessions. Searches on Google’s vertical search pages are excluded. Searches are grouped into sessions such that if the inter-arrival time between two searches exceeds 5 minutes, the second query is considered a new session. When evaluated against 100 randomly sampled, manually annotated query pairs from the pilot, this method produced an F1 score of 0.84.
21
PDF Page 22
Draft
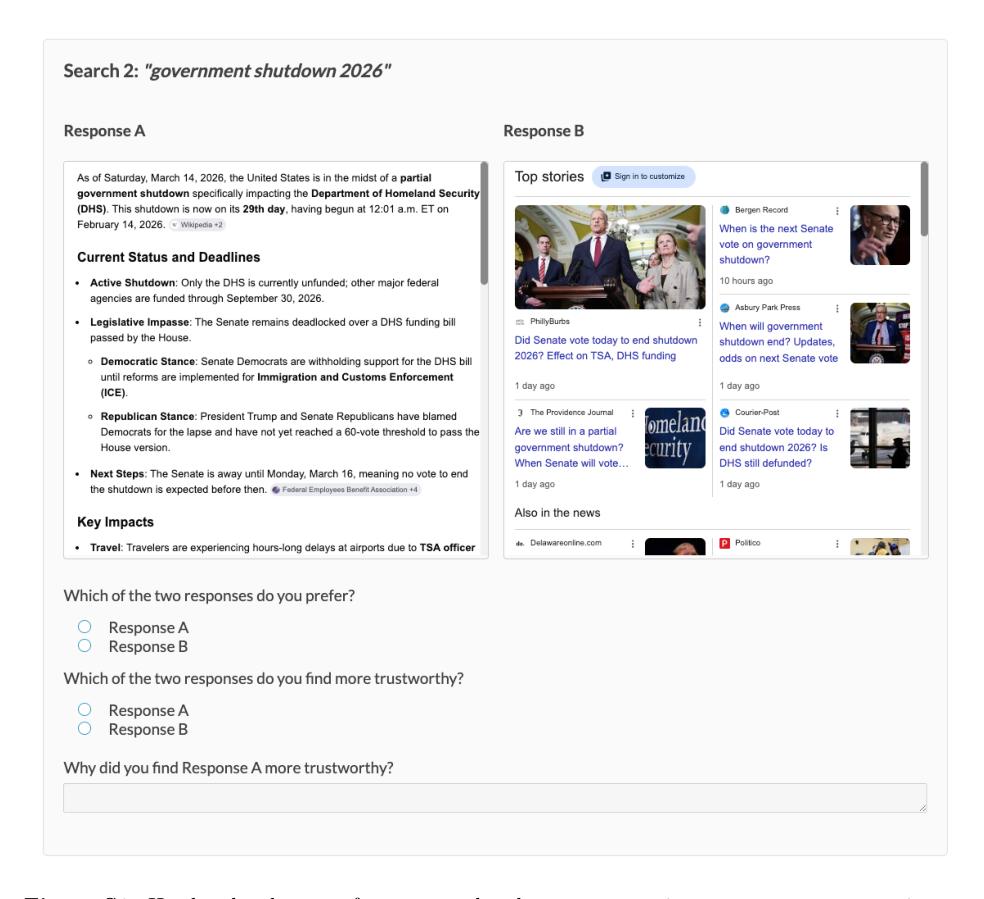
Figure S1. Head to head survey for a news-related query, prompting users to answer questions comparing Response A (AI Mode result for news query) to Response B (Current search result for news query).
22
PDF Page 23
Draft
Secondary Survey Outcome Measures
• Usefulness. We measure usefulness using a validated 5-item scale [30, 48]. The five items are: “Over the last 7 days, information-seeking on Google was:” [useless vs. useful; bad vs. good; ineffective vs. effective; worthless vs. helpful; sleep-inducing vs. stimulating]. Each item is measured on a 5-point scale.
• Satisfaction. We measure satisfaction using a validated 4-item scale [30, 48]. The four items are: “Over the last 7 days, information-seeking on Google was:” [unpleasant vs. pleasant; annoying vs. nice; irritating vs. likeable; undesirable vs. desirable]. Each item is measured on a 5-point scale.
• Agency. Measured through a single statement: “Over the last 7 days, I had agency over the information-seeking process on Google,” on a 7-point Likert scale (strongly disagree to strongly agree).
• Personalization. Measured through a single statement: “Over the last 7 days, informationseeking on Google led to results that were personalized and relevant to me,” on a 7-point Likert scale (strongly disagree to strongly agree).
• Preference for AI Mode (News Context). We show participants head-to-head comparisons of responses from AI Mode Search and Current Search, asking “Which of the two responses do you prefer?” (Figure S1). Each participant is shown the results of three queries randomly sampled from 10 pre-defined trending news queries, manually selected from Google Trends the day before the final survey is released. The order of responses is randomized.
• Trust in AI Mode (News Context). Using the same design as above, participants are asked “Which of the two responses do you find more trustworthy?”
The selected trending news queries were (1) “tsa agents government shutdown”, (2) “iran israel war ceasefire”, (3) “laguardia plane crash”, (4) “us treasury insolvency”, (5) “us army enlistment age”, (6) “meta social media addiction trial”, (7) “retirement benefits social security”, (8) “no kings protest near me”, (9) “covid 19 cicada variant”, and (10) “ice at airports”.
Secondary Click Outcomes
All secondary click outcomes except total clicks are binary user-level variables (e.g., did user X ever click through to a news site).
• Clicks. Total external clicks originating from Google, excluding clicks to [www.google.com](https://www.goog
• Clicks to news websites > 0. News domains are identified using a comprehensive, actively curated list of news domains [49].
• Clicks to specific domains > 0. Any domain receiving at least 5% of total clicks originating from Google during the baseline period. During the pilot, only reddit.com and wikipedia.org met this criterion.
• Ad clicks > 0. Ad clicks are identified using the gclid URL parameter [50].
23
PDF Page 24
Draft
Secondary Search Outcomes
All variables in this section exclude searches on Google’s vertical search pages. All are user-level metrics.
• Searches per session. Total searches divided by total sessions. Each turn of a conversation in AI Mode is counted as a separate search.
• Minutes per session. Total active minutes on Google Search pages divided by total sessions. Time is only accumulated when a Google Search page is in the browser’s foreground.
• Fraction of question searches. The fraction of searches beginning with “who”, “what”, “where”, “why”, “when”, or “how”.
Secondary Substitution Outcomes
• Competing search engine use > 0. A binary user-level variable indicating whether the user ran any searches on Bing, Yahoo, or DuckDuckGo.
• Intention to switch to Bing. Measured by asking “If your search experience from the last 7 days remained permanent, how likely would you be to switch to Bing?” on a 7-point Likert scale (extremely unlikely to extremely likely).
S2.5 Hypotheses
Primary Hypotheses
H1 (Trust): Based on existing work on trust in AI search responses [28].
H1a: AI Mode Search will decrease overall trust in responses compared to Current Search.
H1b: No AI Search will increase overall trust in responses compared to Current Search.
H2 (Click-Through Rate): Based on reports from publishers [6] and observational data [8].
H2a: AI Mode Search will decrease click-through rate to external sites compared to Current Search.
H2b: No AI Search will increase click-through rate to external sites compared to Current Search.
H3 (Search Sessions): Based on Google’s claims about the impact of AI features [10].
H3a: AI Mode Search will increase the number of search sessions compared to Current Search.
H3b: No AI Search will decrease the number of search sessions compared to Current Search.
Secondary Hypotheses: Survey Outcomes
H4 (Satisfaction, Usefulness, Agency): We don’t have a strong hypothesis (H4a). AI Mode Search could decrease [satisfaction with, usefulness from, agency over] responses compared to Current Search because of information quality concerns. It could also increase these outcomes because of perceived efficiency, personalization, and/or relevance. Analogous reasoning for No AI Search (H4b).
24
PDF Page 25
Draft
H4 (Personalization/Relevance): Based on Google’s claims [41].
H4c: AI Mode Search will increase perceptions of responses being personalized and relevant.
H4d: No AI Search will decrease perceptions of responses being personalized and relevant.
H4 (News Context):
H4e: AI Mode Search will decrease preference for and trust in AI Mode in the context of news
search.
H4f: No AI Search will have no impact on these outcomes.
Secondary Hypotheses: Click Outcomes
H5 (Clicks to domains):
H5a: AI Mode Search will decrease total clicks, clicks to news sites, clicks to specific domains, and
ad clicks compared to Current Search.
H5b: No AI Search will increase these outcomes compared to Current Search.
Secondary Hypotheses: Search Behavior
H6 (Session Characteristics):
H6a: AI Mode Search will increase minutes per session and the fraction of question-form searches
compared to Current Search.
H6b: No AI Search will decrease these outcomes compared to Current Search.
H6 (Searches per Session): No strong hypothesis; AI Mode Search could increase or decrease searches per session depending on whether it encourages follow-up queries or resolves them preemptively (H6c), with analogous reasoning for No AI Search (H6d).
Secondary Hypotheses: Search Engine Substitution
H7 (Substitution):
H7a: AI Mode Search will increase substitution to other search engines (Bing, DuckDuckGo, Yahoo)
compared to Current Search.
H7b: No AI Search will have no impact on substitution to other search engines.
S3 Participant Demographics
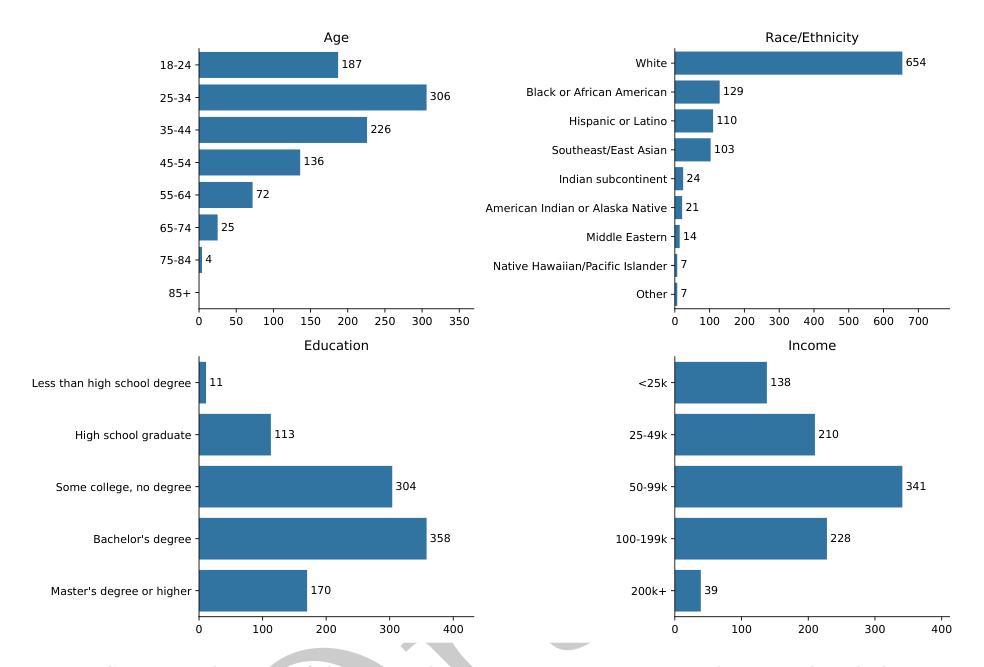
Of the 956 participants who completed the final survey, 50% identified as women, 48% as men, and 2% as another gender. Politically, participants leaned Democratic, as 59% identified as Democrat (30% strong, 13% weak, 16% leaning), 21% as Independent, and 20% as Republican (10% leaning, 4% weak, 6% strong). Figure S2 presents the demographic composition of the survey analysis sample across four other characteristics: age, race, education, and income. Table S6 summarizes
25
PDF Page 26
Draft
the demographic composition of the enrolled sample (N = 1, 444), the behavioral analysis sample (N = 1, 100) and the survey analysis sample (N = 956).
0 50 100 150 200 250 300 350
18-24
25-34
35-44
45-54
55-64
65-74
75-84
85+
187
306
226
136
72
25
4
Age
0 100 200 300 400 500 600 700
White
Black or African American
Hispanic or Latino
Southeast/East Asian
Indian subcontinent
American Indian or Alaska Native
Middle Eastern
Native Hawaiian/Pacific Islander
Other
654
129
110
103
24
21
14
7
7
Race/Ethnicity
0 100 200 300 400
Less than high school degree
High school graduate
Some college, no degree
Bachelor's degree
Master's degree or higher
11
113
304
358
170
Education
0 100 200 300 400
<25k
25-49k
50-99k
100-199k
200k+
138
210
341
228
39
Income
Figure S2. Distribution of demographics among participants who completed the post-survey.
26
PDF Page 27
Draft
Table S6. Participant Demographics. Demographic composition of the enrolled sample, the behavioral analysis sample, and the survey analysis sample.
Enrolled (N=1444) Behavioral (N=1100) Survey (N=956)
Age: 18-24 (%) 0.222 0.212 0.196 Age: 25-34 (%) 0.298 0.309 0.320 Age: 35-44 (%) 0.235 0.231 0.236 Age: 45-54 (%) 0.142 0.145 0.142 Age: 55-64 (%) 0.075 0.075 0.075 Age: 65-74 (%) 0.024 0.025 0.026 Age: 75-84 (%) 0.005 0.005 0.004 Age: 85+ (%) 0.000 0.000 0.000 Education: Less than high school degree (%) 0.013 0.010 0.012 Education: High school graduate (%) 0.126 0.120 0.118 Education: Some college, no degree (%) 0.329 0.335 0.318 Education: Bachelor’s degree (%) 0.357 0.357 0.374 Education: Master’s degree or higher (%) 0.175 0.178 0.178 Income: <25k (%) 0.151 0.145 0.144 Income: 25-49k (%) 0.219 0.219 0.220 Income: 50-99k (%) 0.350 0.359 0.357 Income: 100-199k (%) 0.228 0.230 0.238 Income: 200k+ (%) 0.053 0.046 0.041 Political Party: Strong Democrat (%) 0.278 0.292 0.298 Political Party: Weak Democrat (%) 0.115 0.124 0.132 Political Party: Lean Democrat (%) 0.166 0.165 0.159 Political Party: Independent (%) 0.234 0.222 0.214 Political Party: Lean Republican (%) 0.098 0.100 0.099 Political Party: Weak Republican (%) 0.043 0.039 0.038 Political Party: Strong Republican (%) 0.066 0.058 0.060 Gender: Woman (%) 0.513 0.499 0.500 Gender: Man (%) 0.467 0.480 0.477 Gender: Nonbinary (%) 0.018 0.020 0.022 Race/Ethnicity: White (%) 0.669 0.679 0.684 Race/Ethnicity: Black or African American (%) 0.159 0.145 0.135 Race/Ethnicity: Hispanic or Latino (%) 0.107 0.109 0.115 Race/Ethnicity: Southeast/East Asian (%) 0.103 0.106 0.108 Race/Ethnicity: Indian subcontinent (%) 0.022 0.025 0.025 Race/Ethnicity: American Indian or Alaska Native (%) 0.023 0.024 0.022 Race/Ethnicity: Middle Eastern (%) 0.017 0.017 0.015 Race/Ethnicity: Native Hawaiian/Pacific Islander (%) 0.006 0.006 0.007 Race/Ethnicity: Other (%) 0.006 0.006 0.007
S4 Analysis Plan
S4.1 Randomization
Participants were randomly assigned to one of three experimental conditions at the time of extension installation, whereby each participant was independently assigned with equal probability and no constraints imposed on group balance.
S4.2 Power analysis
To determine minimum detectable effects (MDEs) at various sample sizes, we ran a power analysis based on a pilot study with N = 72 participants (61 from Prolific and 11 from a paid, undergraduate work-study program at Northeastern). The power analysis used power = 0.8, alpha = 0.05 / H hypothesis tests, and the residual outcome variance after adjusting for the pre-treatment outcome. H came from our pre-registered multiple testing plan for different groups of covariates (e.g., for primary outcomes, H = 3 outcomes * 2 contrasts = 6 hypothesis tests). The residual outcome variance was calculated as the unadjusted outcome variance * (1 - out-of-sample R2). Out-of-
27
PDF Page 28
Draft
sample R2 was estimated using OLS regression and 10-fold cross validation. We used out-of-sample R2 to estimate residual variance conservatively with a small pilot. Our pre-registration reported MDEs corresponding to N = 1200 total participants. Our final analysis sample contains N = 1100 participants with behavioral data and N = 956 participants with survey data. Therefore, we report MDEs with respect to these realized sample sizes here. Note that MDEs are still calculated using pilot data, just assuming a smaller sample size. We were powered to detect minimum effects of 0.24 (4%) on searcher trust, 0.07 (16%) on click-through rate, and 0.61 (16%) on search sessions per day. For secondary survey outcomes, we were powered to detect minimum effects of 0.19 (5%) on satisfaction, 0.16 (4%) on usefulness, and 0.42 (10%) on agency. We did not measure personalization/relevance, preference for AI Mode in the context of news search, and trust in AI Mode in the context of news search during the pilot. For secondary click outcomes, we were powered to detect minimum effects of 1.3 (35%) on clicks per day, 0.13 (28%) on the proportion of users clicking to Reddit, 0.12 (40%) on the proportion of users clicking to Wikipedia, 0.13 (35%) on the proportion of users clicking to news sites, and 0.14 (33%) on the proportion of users clicking on ads. For secondary search outcomes, we were powered to detect minimum effects of 0.26 (12%) on searches per session, 0.42 (33%) on minutes per session and 0.02 (34%) on the fraction of question searches. For secondary substitution outcomes, we were powered to detect a minimum effect of 0.08 (79%) on the proportion of people using a competing search engine. We did not measure long-term intention to switch to Bing during the pilot.
S4.3 Main Analyses
Following our pre-registration, for all user-level outcomes, we run an OLS regression of the outcome on participants’ treatment assignment, controlling for the baseline value of the outcome and recruitment channel. We use HC2 robust standard errors. For the news-related survey outcomes, each participant answered questions about three queries that are randomly sampled from a set of 10. Following our pre-registration, for these two outcomes, we run an OLS regression of the outcome on participants’ treatment assignment at the question-level, with fixed effects for question ID. We control for baseline trust and recruitment channel and cluster standard errors at the user-level. Our pre-registration did not specify how we would estimate LATEs in the case of non-compliance. We run a two-stage least squares (2SLS) regression of the outcome on participants’ treatment exposure (i.e., compliance rate), instrumented by treatment assignment, controlling for the baseline value of the outcome and recruitment channel. We use HC1 robust standard errors, which are supported in Python’s linearmodels package. Following our pre-registration, we recode any missing covariate values to the overall mean from the baseline period. Following our pre-registration, we also truncate behavioral measures (sessions per day, clicks per day, click-through rate, searches per session, and minutes per session) at the 99th percentile to deal with possible outliers. We calculate 99th percentiles using data from the baseline period. We do not truncate behavioral proportions. We also truncate the focus duration of individual searches at the 99th percentile (24.4 minutes).
Multiple Comparisons
We implement False Discovery Rate (FDR) adjustment using the method in [51] with the following groups of variables:
• For K1 = 3 primary outcomes: Sharpened FDR-adjusted p-values with K1 ∗2 hypothesis tests (multiplied by 2 because 2 condition contrasts)
• For K2 = 6 survey-related secondary outcomes: Sharpened FDR-adjusted p-values with (K2 + 1) ∗2 hypothesis tests, where the extra outcome is the primary trust outcome
28
PDF Page 29
Draft
Table S7. Covariate Balance. Baseline covariate means across treatment groups.
No AI Current Search AI Mode
Sessions Per Day 2.896 3.465 3.183 Clicks Per Day 3.130 3.455 3.332 Trust 4.432 4.384 4.425 Satisfaction 3.884 3.887 3.900 Usefulness 4.169 4.132 4.132 Agency 4.632 4.659 4.671 Personalization/Relevance 5.087 5.031 4.992 LLM Familiarity 5.195 5.071 5.150 LLM Overall Sentiment 3.772 3.646 3.698 LLM Use Frequency 3.638 3.512 3.637 Race/Ethnicity: White (%) 0.685 0.644 0.676 Race/Ethnicity: Black or African American (%) 0.140 0.169 0.168 Race/Ethnicity: Southeast/East Asian (%) 0.083 0.127 0.103 Race/Ethnicity: Hispanic or Latino (%) 0.120 0.094 0.107 Race/Ethnicity: Other (%) 0.031 0.045 0.041 Gender: Woman (%) 0.518 0.514 0.507 Gender: Man (%) 0.467 0.463 0.472 Gender: Nonbinary (%) 0.016 0.022 0.021 Age: 18-24 (%) 0.219 0.207 0.238 Age: 25-34 (%) 0.307 0.303 0.283 Age: 35-44 (%) 0.240 0.236 0.230 Age: 45-54 (%) 0.124 0.149 0.154 Age: 55+ (%) 0.110 0.105 0.094 Education: High school graduate (%) 0.144 0.143 0.131 Education: Some college, no degree (%) 0.339 0.327 0.320 Education: Bachelor’s degree (%) 0.354 0.330 0.384 Education: Master’s degree or higher (%) 0.163 0.200 0.164 Political Party: Democrat (%) 0.541 0.543 0.591 Political Party: Independent (%) 0.258 0.227 0.216 Political Party: Republican (%) 0.201 0.229 0.193 Income: <25k (%) 0.167 0.167 0.119 Income: 25-49k (%) 0.230 0.205 0.220 Income: 50-99k (%) 0.352 0.356 0.341 Income: 100k+ (%) 0.250 0.272 0.320 Channel: NEU (%) 0.047 0.033 0.037 Channel: Prolific (%) 0.953 0.967 0.963
• For K2 = 5 click-related secondary outcomes: Sharpened FDR-adjusted p-values with (K2+ 1) ∗2 hypothesis tests, where the extra outcome is the primary CTR outcome
• For K2 = 3 search-related secondary outcomes: Sharpened FDR-adjusted p-values with (K2 + 1) ∗2 hypothesis tests, where the extra outcome is the primary sessions outcome
• For K2 = 2 substitution-related secondary outcomes: Sharpened FDR-adjusted p-values with K2 ∗2 hypothesis tests
• For L1 = 4 (i.e., 2 moderators * 2 levels): Sharpened FDR-adjusted p-values with K1∗L1∗2 hypothesis tests.
For each group of variables, we adjust the set of ITT and LATE estimates separately because they represent the same group of hypothesis tests.
29
PDF Page 30
Draft
S5 Validity Checks
S5.1 Covariate balance
Following our pre-registration, we use randomization inference to test whether observed covariate imbalances are larger than would be expected by chance[52]. Specifically, we fit a multinomial logistic regression of treatment assignment on baseline covariates and calculate a heteroskedasticityrobust Wald statistic for the hypothesis that all coefficients are equal to zero. We use randomization inference with 10,000 random assignments to calculate the p-value associated with the test statistic. Following our pre-registration, we included the following covariates: recruitment channel, demographics (race/ethnicity, gender identity, age, education, political party, household income), baseline survey measures (trust, satisfaction, usefulness, agency, personalization/relevance, LLM familiarity, LLM sentiment, and LLM use frequency), and baseline outcomes (search sessions per day and clicks per day). We coarsened all demographic covariates except for gender identity. We do not find evidence of covariate imbalance (p = 0.305). Table S7 shows covariate means in each treatment group.
S5.2 Compliance and manipulation checks
2 4 6 8 10 Experiment Day
0.0
0.1
0.2
0.3
0.4
Fraction of Searches with an AI Overview
AI Mode Current Search No AI
Figure S3. Fraction of Searches with AI Overviews Across Experiment Days. The fraction of searches with an AI Overview across conditions and experiment days.
Following our pre-registration, we measure the success of the No AI Search intervention by looking at the proportion of AI Overview HTML elements that were successfully hidden. We measure the success of the AI Mode intervention by looking at the proportion of Google searches routed to AI Mode according to URL parameters. Figure S4 shows the fraction of AI Overviews successfully hidden across experiment days (i.e., time relative to onboarding) in the No AI group. On the first experiment day, around 90% of AI Overviews were successfully hidden. However, the success rate declined linearly as the experiment continued and was close to 0% by the tenth experiment day. The reason for the declining success rate is that Google rolled out a change to the AI Overview HTML during the experiment. This broke our extension’s logic for identifying and hiding AI Overviews. Figure S5 shows the fraction of AI Overviews that were successfully hidden across
30
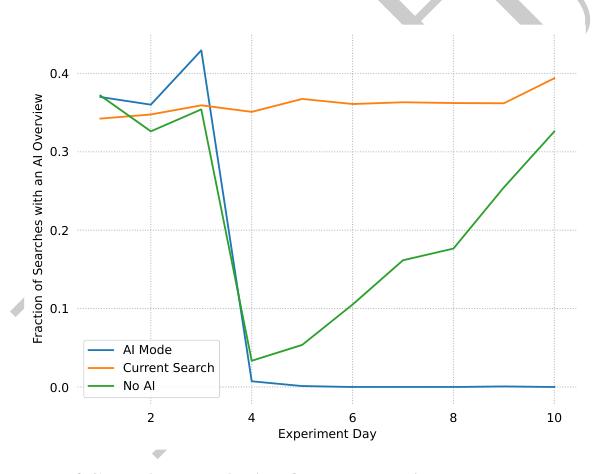
PDF Page 31
Draft
2 4 6 8 10 Experiment Day
0.0
0.2
0.4
0.6
0.8
Fraction of AI Overviews Hidden (Search-Level)
Figure S4. Fraction of AI Overviews Hidden Across Experiment Days. The fraction of AI Overviews hidden in the No AI group on each experiment day.
participants. Overall, 51.1% of AI Overviews were successfully hidden and the median participant had 50% of AI Overviews hidden. Figures S6 and S7 show the fraction of searches routed to AI Mode across treatment conditions at the user-level and search-level, respectively. During the baseline period, usage of AI Mode was extremely sparse across groups (0.6% of searches). During the experiment, 94.7% of searches in the AI Mode group were successfully routed to AI Mode. Six participants successfully accessed web search results (i.e., google.com/search?q=testing&udm=14) by using a non-standard URL structure (i.e., google.com//search) on which our intervention did not fire. As expected, 0.4% of searches went to AI Mode in the Current Search group, where AI mode remained accessible, and 0% of searches went to AI Mode in the No AI group. Our pre-registration specified that we would report local average treatment effect (LATE) estimates if we detected noncompliance, where individual compliance was defined as receiving the assigned treatment on at least 90% of searches. However, due to the breakdown of our No AI intervention, we instead measure compliance continuously, i.e., as the fraction of AI Overviews that were successfully hidden for each participant (see Figure S5). We measure compliance analogously in the AI Mode intervention, i.e., as the fraction of searches that were routed to AI Mode for each participant. Although not preregistered, we exclude users who did not run any searches that would have triggered an AI Overview from our LATE estimate comparing No AI Search to Current Search. Exposure is undefined for these users, and other than losing access to AI Mode, they could not have been affected by the No AI intervention. This subset constitutes 17.9% of the No AI group and 16.3% of the Current Search group. Using the same differential attrition tests that we use in the following section, we do not find evidence of differential rates (p = 0.564) or patterns (p = 0.693) among this subset.
S5.3 Differential attrition
Following our pre-registration, we use randomization inference to test for differential attrition rates [52]. Specifically, we fit an OLS regression of attrition indicator on treatment assignment and calculate a heteroskedasticity-robust F-statistic for the hypothesis that all coefficients are equal to zero. We use randomization inference with 10,000 random assignments to calculate the p-
31
PDF Page 32
Draft
0.0 0.2 0.4 0.6 0.8 1.0 Fraction of AI Overviews Hidden (User-Level)
0
10
20
30
40
50
60
70
80
Number of Users
Figure S5. Fraction of AI Overviews Hidden Across Participants. The fraction of AI Overviews successfully hidden across participants in the No AI group.
value associated with the test statistic. We also use randomization inference to test for differential attrition patterns [52]. Specifically, we fit an OLS regression of attrition indicator on treatment assignment, covariates, and treatment-covariate interactions and calculate a heteroskedasticityrobust F-statistic for the hypothesis that all interaction coefficients are equal to zero. We use the same set of covariates as in the covariate balance test. We use randomization inference with 10,000 random assignments to calculate the p-value associated with the test statistic. Following our pre-registration, we measured attrition in two ways: (1) participants who did not complete the final survey and (2) participants with zero searches during the experiment period. The fraction of participants who did not complete the final survey was 32.5% in the No AI group, 32.3% in the Current Search group, and 36.6% in the AI group. We do not find evidence of differential attrition rates (p = 0.292) or patterns (p = 0.591). The fraction of participants with zero searches during the experiment period was 24.0% in the No AI group, 20.7% in the Current Search group, and 26.5% in the AI group. The difference between these rates is marginal (p = 0.109), but not significant at the 0.05 threshold [52], and we do not find evidence of differential attrition patterns (p = 0.208).
32
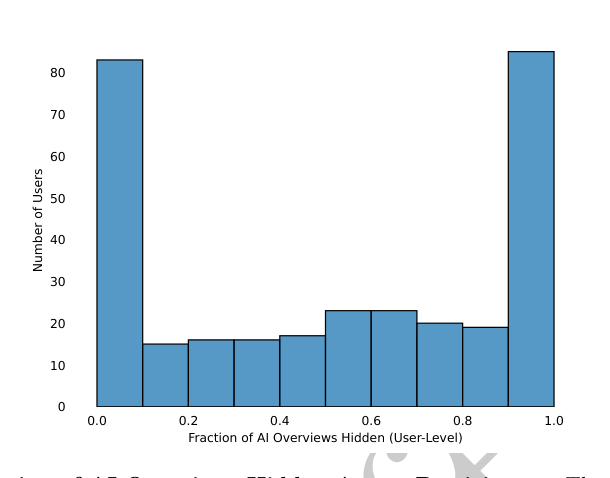
PDF Page 33
Draft
2 4 6 8 10 Experiment Day
0.0
0.2
0.4
0.6
0.8
1.0
Fraction of AI Mode Searches (User-Level)
AI Mode Current Search No AI
Figure S6. Fraction of Searches Routed to AI Mode (User-Level). Each user is given equal weight.
S6 Supplementary Results
S6.1 Robustness Checks
0.2 0.1 0.0 0.1 0.2
Click-Through Rate
AI Mode vs. Current
0.2 0.1 0.0 0.1 0.2
No AI vs. Current
1.5 1.0 0.5 0.0 0.5 1.0 1.5
Effect
Sessions per Day
1.5 1.0 0.5 0.0 0.5 1.0 1.5
Effect
Estimand
ITT LATE
Figure S12. Analysis of Primary Behavioral Outcomes among Subset that Completed the Final Survey (N = 956).
We conduct the following pre-registered robustness checks:
33
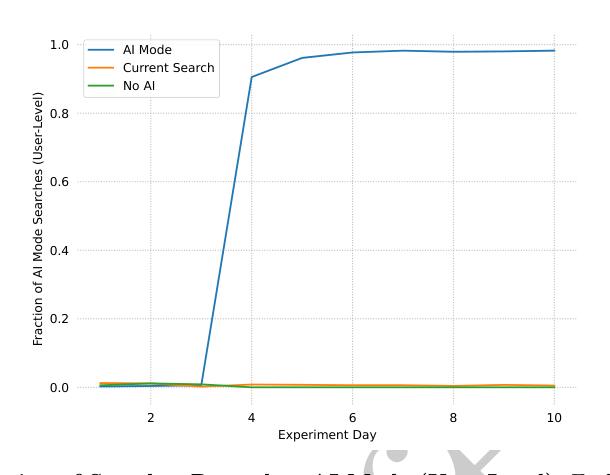
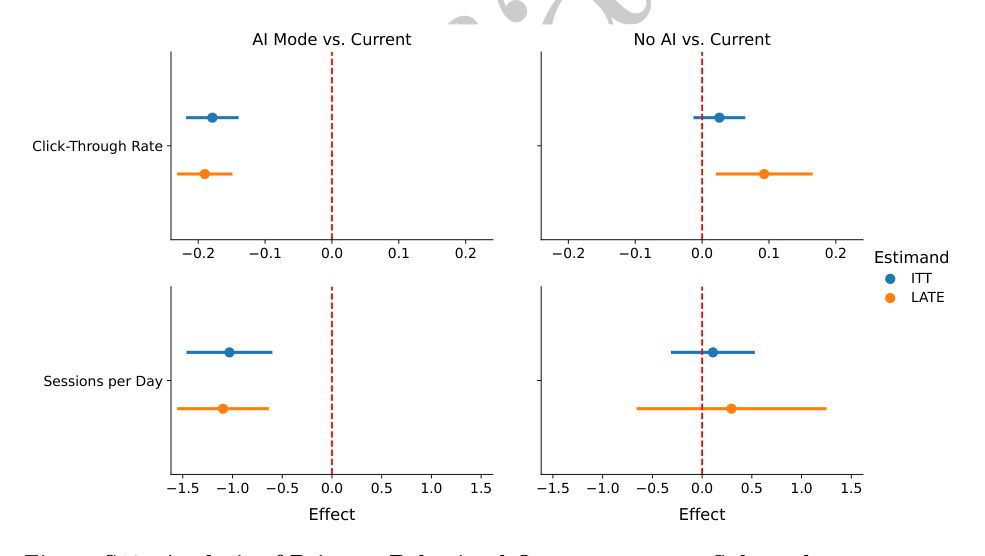
PDF Page 34
Draft
2 4 6 8 10 Experiment Day
0.0
0.2
0.4
0.6
0.8
1.0
Fraction of AI Mode Searches (Search-Level)
AI Mode Current Search No AI
Figure S7. Fraction of Searches Routed to AI Mode (Search-Level). Each search is given equal weight.
• The effect of AI Mode on click-through rate is robust to counting each AI Mode conversation as one search, rather than counting each AI Mode prompt as one search (Table S8).
• The effects of AI Mode and No AI on click-through rate are robust to analysis at the searchlevel instead of the user-level (Figure S8, top panel). We analyzed click-through rate at the search-level by running OLS regression using the same controls and clustering standard errors at the user-level.
• The effects of AI Mode and No AI on sessions per day are robust to defining sessions using 3-minute boundaries and 10-minute boundaries instead of 5-minute boundaries (Table S9).
• The effect of AI Mode on clicks to news sites is robust to using Google’s Topics API (taxonomy 2, version 5) to classify news domains instead of [49] (Table S10).
• The effect of No AI on clicks to news sites is not robust to using Google’s Topics API (taxonomy 2, version 5) to classify news domains instead of [49] (Table S10).
• The effects of AI Mode on clicks to news sites, Reddit, Wikipedia, and ads are robust to using clicks per day instead of fraction of users who clicked (Figure S9, left panel).
• The effect of No AI on clicks to news sites is not robust to using clicks per day instead of fraction of users who clicked (Figure S9, right panel). Effects on Wikipedia clicks per day and ad clicks per day are still null, while the effect on Reddit clicks per day is slightly positive.
• The effect of AI Mode on minutes per session is robust to analysis at the session-level instead of the user-level (Figure S10, bottom-left panel). We analyzed minutes per session at the sessionlevel by running OLS regression using the same controls and clustering standard errors at the user-level.
• The effect of No AI on minutes per session is somewhat robust to analysis at the sessionlevel instead of the user-level (Figure S10, bottom-right panel). Point estimates are still negative, but are no longer statistically significant.
34
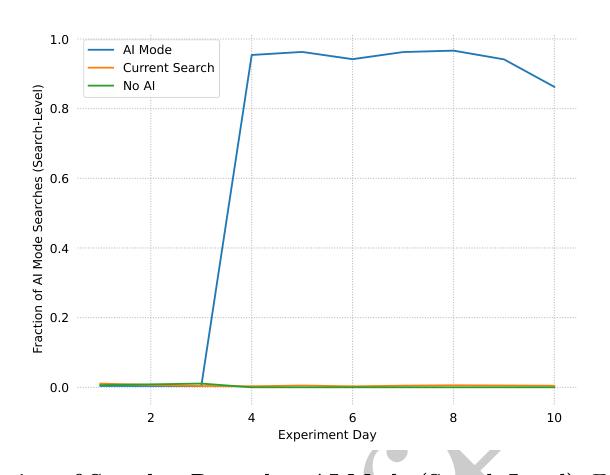
PDF Page 35
Draft
0.2 0.1 0.0 0.1 0.2
Click-Through Rate
AI Mode vs. Current
0.2 0.1 0.0 0.1 0.2
No AI vs. Current
0.04 0.02 0.00 0.02 0.04
Effect
Fraction of Question Searches
0.04 0.02 0.00 0.02 0.04
Effect
Estimand
ITT LATE
Figure S8. Analysis of Click-Through Rate and Fraction of Question Searches using Search as the Analysis Unit.
0.75 0.50 0.25 0.00 0.25 0.50 0.75
Effect on Clicks per Day
News Clicks per Day
Reddit Clicks per Day
Wikipedia Clicks per Day
Ad Clicks per Day
AI Mode vs. Current
0.75 0.50 0.25 0.00 0.25 0.50 0.75
Effect on Clicks per Day
No AI vs. Current
Estimand
ITT LATE
Figure S9. Analysis of Secondary Click Outcomes using Clicks per Day.
35
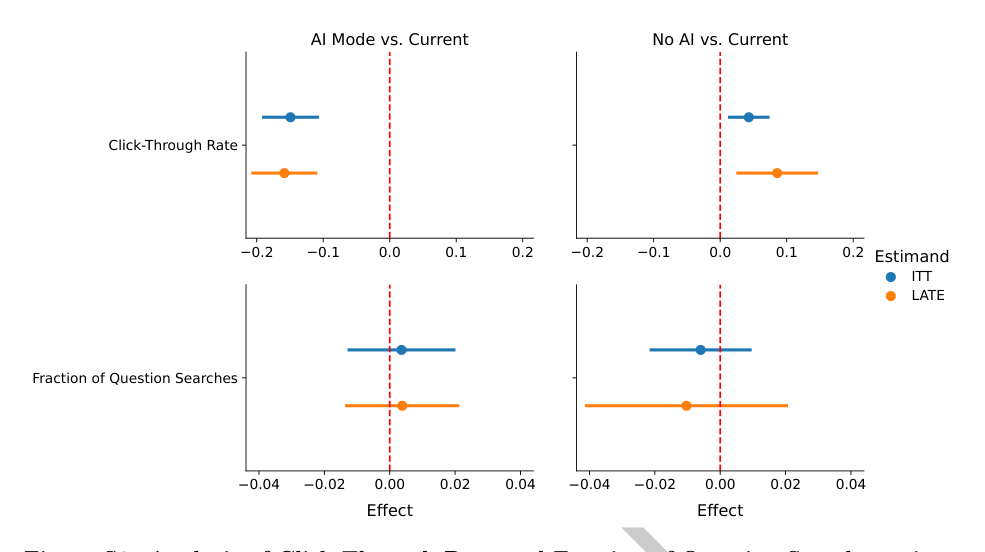
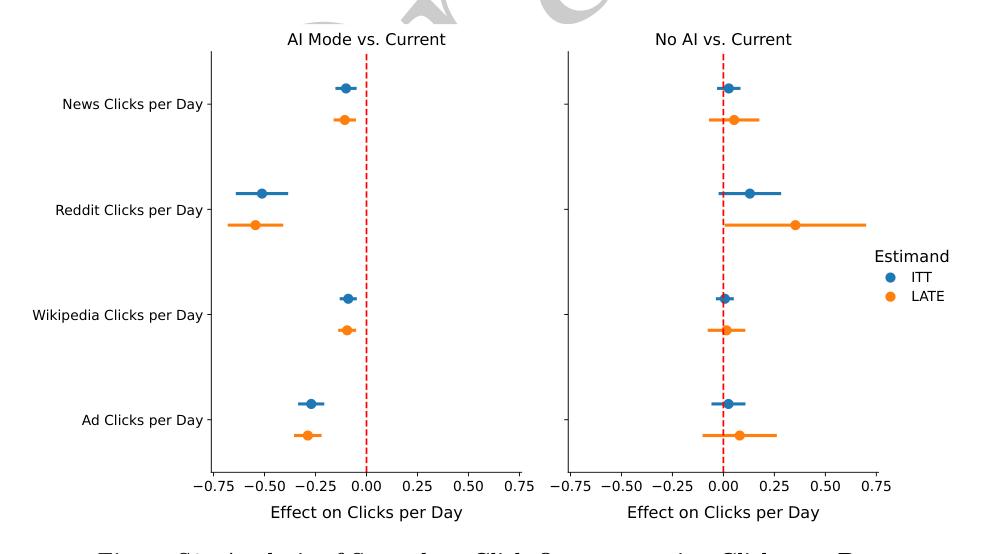
PDF Page 36
Draft
0.3 0.2 0.1 0.0 0.1 0.2 0.3
Searches per Session
AI Mode vs. Current
0.3 0.2 0.1 0.0 0.1 0.2 0.3
No AI vs. Current
0.75 0.50 0.25 0.00 0.25 0.50 0.75
Effect
Minutes per Session
0.75 0.50 0.25 0.00 0.25 0.50 0.75
Effect
Estimand
ITT LATE
Figure S10. Analysis of Searches per Session and Minutes per Session using Session as the Analysis Unit.
• The effects of AI Mode and No AI on searches per session are also null when analyzed at the session-level instead of the user-level (Figure S10, top panel).
• The effects of AI Mode and No AI on fraction of question searches are also null when analyzed at the search-level instead of the user-level (Figure S8, bottom panel).
• The effect of AI Mode and No AI on primary outcomes is robust to using additional controls selected via Lasso regression (Figure S11).
• The effect of AI Mode and No AI on primary behavioral outcomes is robust to restricting to the subset of participants (N = 956) that completed the final survey (Figure S12).
Table S8. Click-Through Rate Estimates Using Different Definitions of AI Mode Searches.
Outcome Version Comparison Estimand N Estimate SE 95% CI p
Click-Through Rate 1 conversation = 1 search AI Mode vs. Current ITT 714 -0.149 0.018 [-0.185, -0.113] <0.001 Click-Through Rate 1 prompt = 1 search AI Mode vs. Current ITT 714 -0.188 0.018 [-0.222, -0.153] <0.001 Click-Through Rate 1 conversation = 1 search AI Mode vs. Current LATE 714 -0.158 0.019 [-0.196, -0.120] <0.001 Click-Through Rate 1 prompt = 1 search AI Mode vs. Current LATE 714 -0.199 0.019 [-0.236, -0.163] <0.001
S6.2 Heterogeneous Treatment Effects
We test for heterogeneous effects on our primary outcomes across two pre-registered moderators: (1) pre-treatment familiarity with LLMs (coarsened) and (2) pre-treatment number of Google sessions (coarsened). We also test for heterogeneous effects across one exploratory moderator:
36
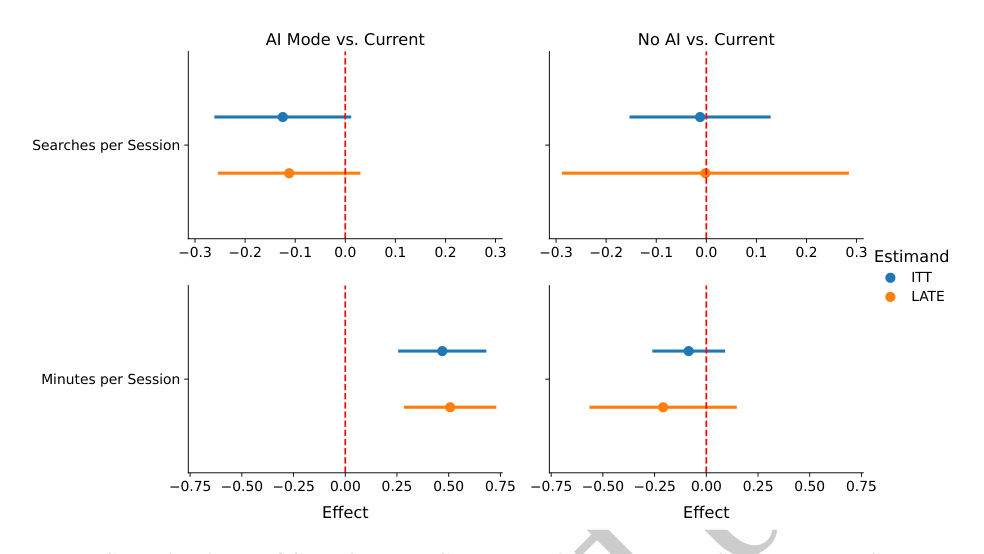
PDF Page 37
Draft
0.4 0.2 0.0 0.2 0.4
Trust Scale
AI Mode vs. Current
0.4 0.2 0.0 0.2 0.4
No AI vs. Current
0.2 0.1 0.0 0.1 0.2
Click-Through Rate
0.2 0.1 0.0 0.1 0.2
1.0 0.5 0.0 0.5 1.0
Effect
Sessions per Day
1.0 0.5 0.0 0.5 1.0
Effect
Estimand
ITT LATE
Figure S11. Analysis of Primary Outcomes using Additional Controls Selected via Lasso.
37
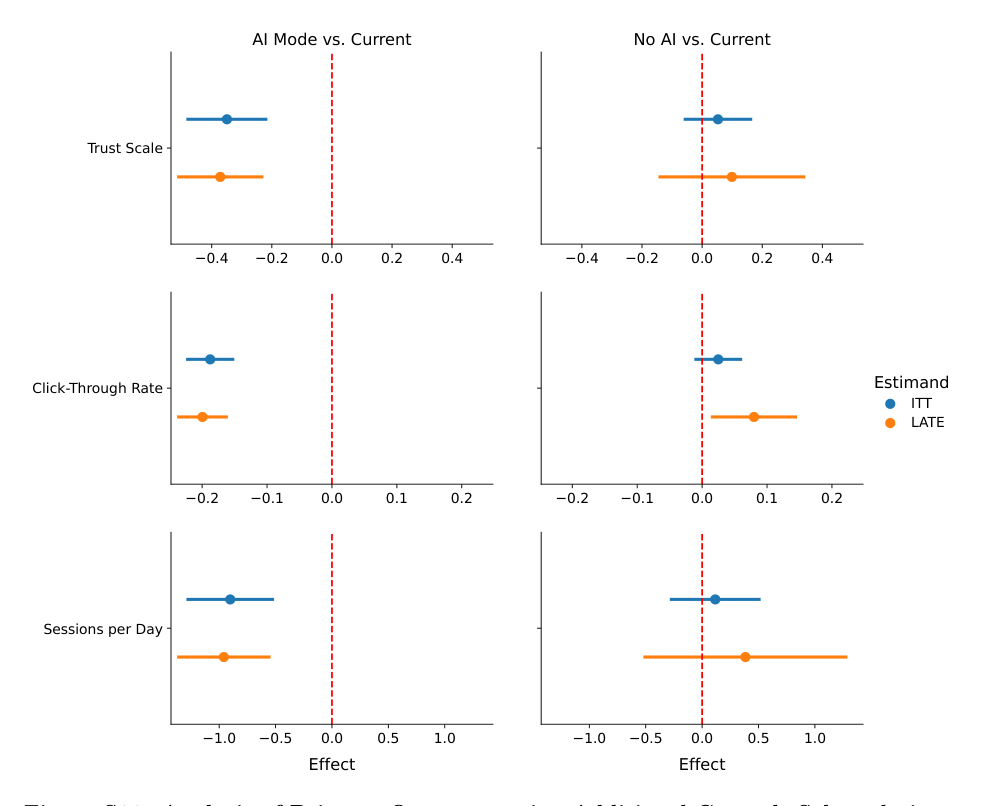
PDF Page 38
Draft
Table S9. Sessions per Day Estimates Using Different Session Length Boundaries.
Outcome Version Comparison Estimand N Estimate SE 95% CI p
Sessions per Day 10 minutes AI Mode vs. Current ITT 714 -0.669 0.151 [-0.964, -0.374] <0.001 Sessions per Day 3 minutes AI Mode vs. Current ITT 714 -1.122 0.224 [-1.562, -0.683] <0.001 Sessions per Day 5 minutes AI Mode vs. Current ITT 714 -0.920 0.192 [-1.296, -0.545] <0.001 Sessions per Day 10 minutes AI Mode vs. Current LATE 714 -0.711 0.161 [-1.026, -0.396] <0.001 Sessions per Day 3 minutes AI Mode vs. Current LATE 714 -1.192 0.239 [-1.661, -0.723] <0.001 Sessions per Day 5 minutes AI Mode vs. Current LATE 714 -0.978 0.204 [-1.379, -0.577] <0.001 Sessions per Day 10 minutes No AI vs. Current ITT 742 0.115 0.152 [-0.183, 0.413] 0.449 Sessions per Day 3 minutes No AI vs. Current ITT 742 0.097 0.233 [-0.360, 0.553] 0.677 Sessions per Day 5 minutes No AI vs. Current ITT 742 0.100 0.197 [-0.287, 0.487] 0.612 Sessions per Day 10 minutes No AI vs. Current LATE 615 0.366 0.347 [-0.316, 1.049] 0.292 Sessions per Day 3 minutes No AI vs. Current LATE 615 0.349 0.537 [-0.705, 1.403] 0.516 Sessions per Day 5 minutes No AI vs. Current LATE 615 0.345 0.453 [-0.545, 1.236] 0.446
Table S10. Fraction of Users Clicking to News Using Different News Domain Labels.
Outcome Version Comparison Estimand N Estimate SE 95% CI p
Fraction of News Clickers Topics API AI Mode vs. Current ITT 714 -0.081 0.017 [-0.114, -0.048] <0.001 Fraction of News Clickers Yang (2026) AI Mode vs. Current ITT 714 -0.125 0.032 [-0.187, -0.063] <0.001 Fraction of News Clickers Topics API AI Mode vs. Current LATE 714 -0.086 0.018 [-0.121, -0.051] <0.001 Fraction of News Clickers Yang (2026) AI Mode vs. Current LATE 714 -0.133 0.034 [-0.199, -0.067] <0.001 Fraction of News Clickers Topics API No AI vs. Current ITT 742 0.001 0.019 [-0.036, 0.037] 0.967 Fraction of News Clickers Yang (2026) No AI vs. Current ITT 742 0.071 0.033 [0.006, 0.137] 0.033 Fraction of News Clickers Topics API No AI vs. Current LATE 615 0.003 0.043 [-0.082, 0.088] 0.940 Fraction of News Clickers Yang (2026) No AI vs. Current LATE 615 0.202 0.073 [0.058, 0.346] 0.006
age. We analyze heterogeneous effects by running OLS regression of the outcome on participants’ treatment assignment, moderator, and treatment-moderator interactions. We run one regression per moderator and report treatment-moderator coefficients. We control for the baseline value of the outcome and recruitment channel, and use HC2 standard errors. We coarsen LLM familiarity into three groups: not familiar at all, slightly familiar, somewhat familiar, and moderately familiar (N = 343), very familiar (N = 312), highly familiar and extremely familiar (N = 445). We coarsen pre-treatment daily search sessions into three groups: up to one daily session (N = 366), 1-4 daily sessions (N = 374), more than 4 daily sessions (N = 360). We coarsen age into four groups: 18–24 (N = 233), 25–34 (N = 340), 35-44 (N = 254), and 45+ (N = 273). Figure S13 shows the results for LLM familiarity: no interactions are significant. Figure S15 shows the results for baseline daily sessions. AI Mode reduces the number of sessions per day significantly more for heavy Google users (i.e., more than 4 daily sessions) (estimate = -2.01 sessions per day, P = 0.005). All other interactions are insignificant after adjusting for multiple comparisons. Figure S14 shows the results for age: no interactions are significant after adjusting for multiple comparisons.
38
PDF Page 39
Draft
0.4 0.2 0.0 0.2 0.4
Trust Scale
1-4 vs. 5
6-7 vs. 5
LLM Familiarity
AI Mode vs. Current (ITT)
0.4 0.2 0.0 0.2 0.4
Trust Scale
No AI vs. Current (ITT)
0.10 0.05 0.00 0.05 0.10
Click-Through Rate
1-4 vs. 5
6-7 vs. 5
LLM Familiarity
0.10 0.05 0.00 0.05 0.10
Click-Through Rate
2 1 0 1 2
Sessions per Day
1-4 vs. 5
6-7 vs. 5
LLM Familiarity
2 1 0 1 2
Sessions per Day
Figure S13. Heterogeneous Effects of AI Mode Search and No AI Search on Primary Outcomes Across Baseline Levels of LLM Familiarity.
39
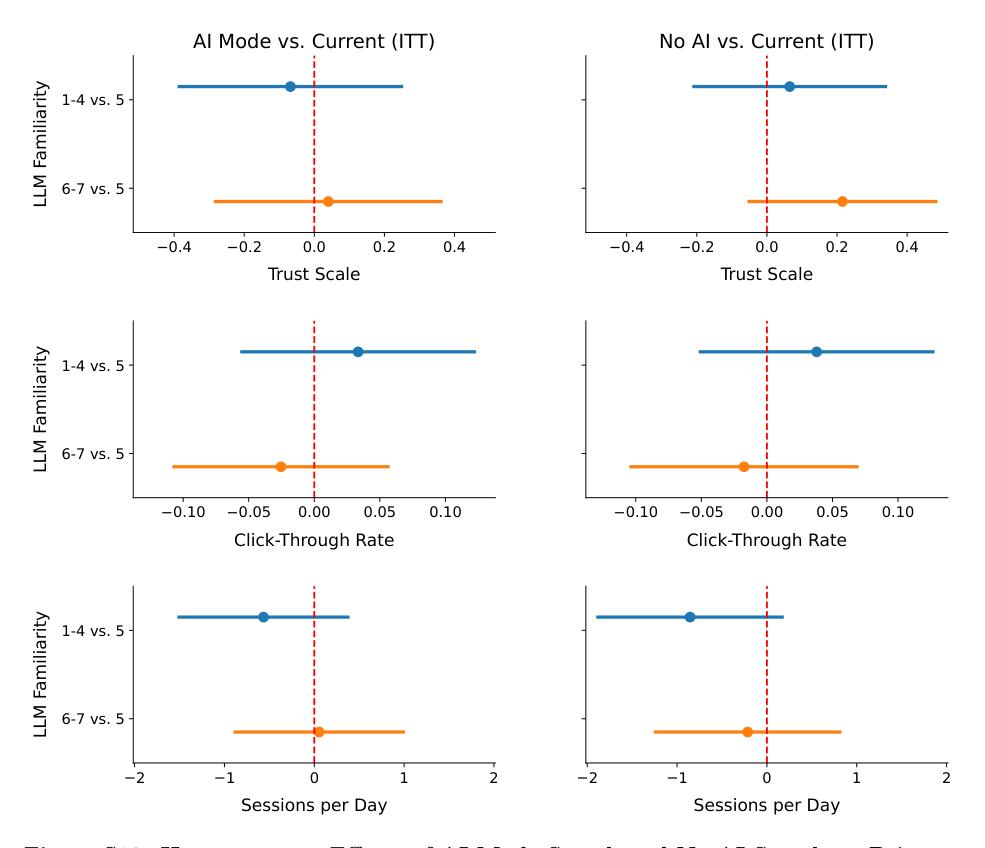
PDF Page 40
Draft
0.75 0.50 0.25 0.00 0.25 0.50 0.75
Trust Scale
18-24 vs. 25-34
35-44 vs. 25-34
45+ vs. 25-34
Age
AI Mode vs. Current (ITT)
0.75 0.50 0.25 0.00 0.25 0.50 0.75
Trust Scale
No AI vs. Current (ITT)
0.15 0.10 0.05 0.00 0.05 0.10 0.15
Click-Through Rate
18-24 vs. 25-34
35-44 vs. 25-34
45+ vs. 25-34
Age
0.15 0.10 0.05 0.00 0.05 0.10 0.15
Click-Through Rate
2 1 0 1 2
Sessions per Day
18-24 vs. 25-34
35-44 vs. 25-34
45+ vs. 25-34
Age
2 1 0 1 2
Sessions per Day
Figure S14. Heterogeneous Effects of AI Mode Search and No AI Search on Primary Outcomes Across Age Groups.
40
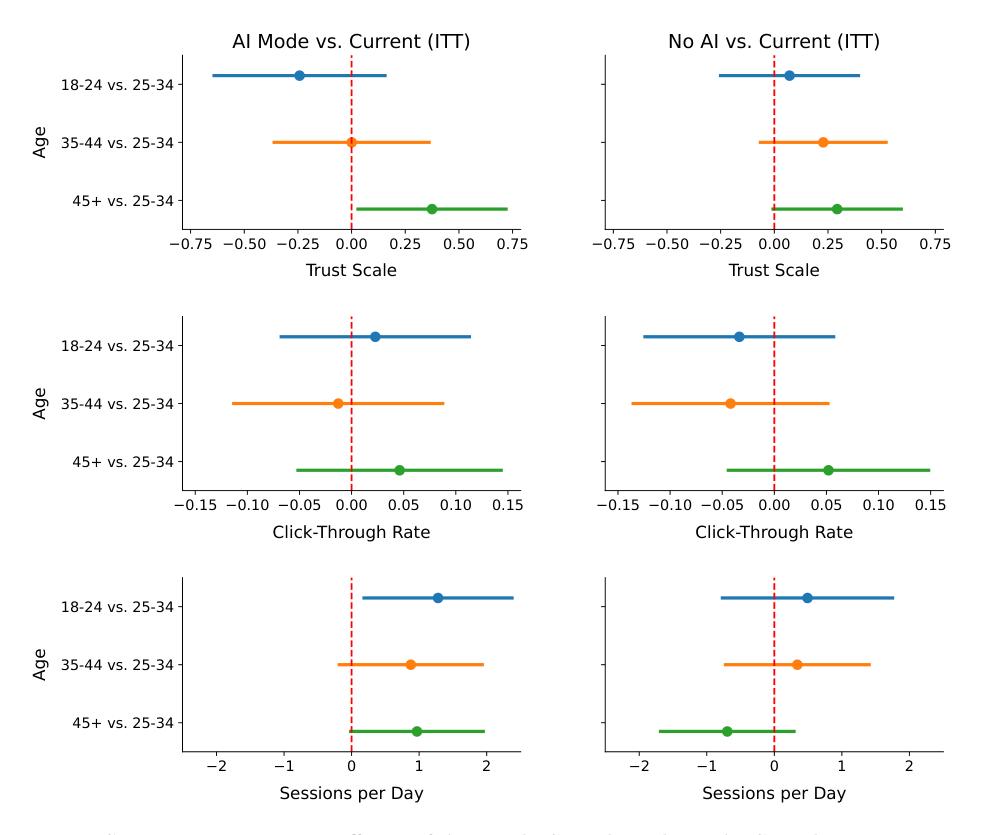
PDF Page 41
Draft
0.6 0.4 0.2 0.0 0.2 0.4 0.6
Trust Scale
0-1 vs. 1-4
4+ vs. 1-4
Baseline Daily Sessions
AI Mode vs. Current (ITT)
0.6 0.4 0.2 0.0 0.2 0.4 0.6
Trust Scale
No AI vs. Current (ITT)
0.15 0.10 0.05 0.00 0.05 0.10 0.15
Click-Through Rate
0-1 vs. 1-4
4+ vs. 1-4
Baseline Daily Sessions
0.15 0.10 0.05 0.00 0.05 0.10 0.15
Click-Through Rate
3 2 1 0 1 2 3
Sessions per Day
0-1 vs. 1-4
4+ vs. 1-4
Baseline Daily Sessions
3 2 1 0 1 2 3
Sessions per Day
Figure S15. Heterogeneous Effects of AI Mode Search and No AI Search on Primary Outcomes Across Baseline Number of Daily Search Sessions.
41
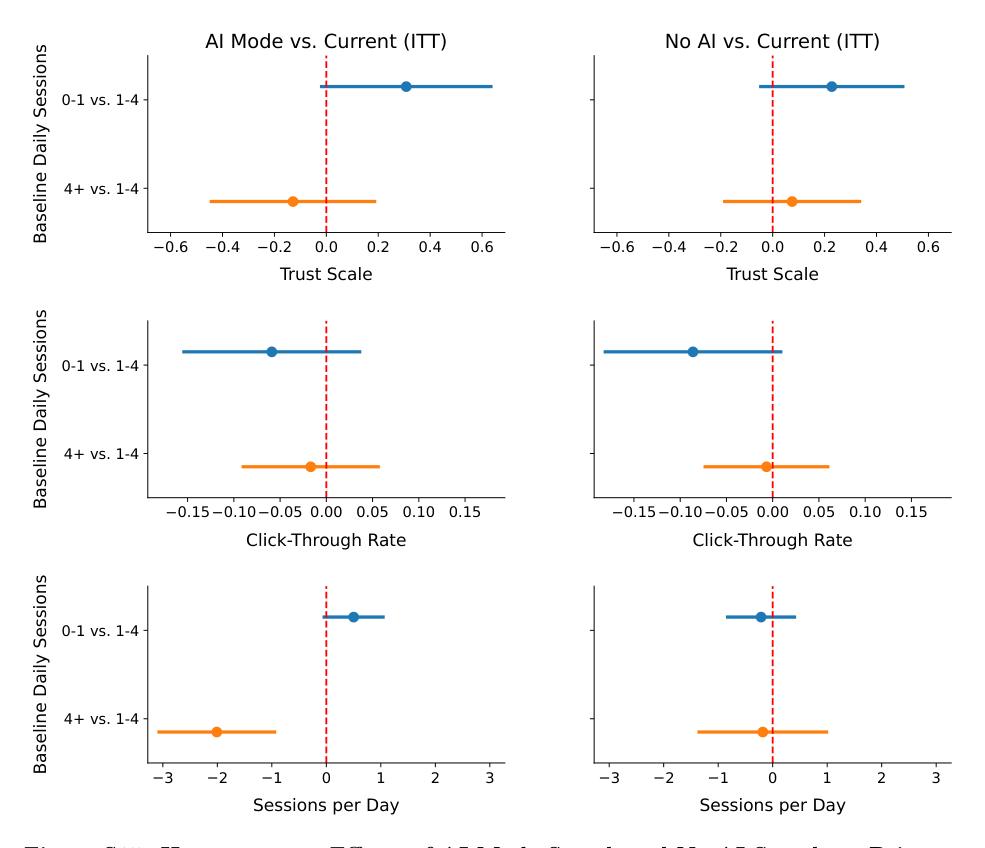
PDF Page 42
Draft
S7 Survey Questionnaires
S7.1 Onboarding
Informed Consent
1. I am living in the United States. (checkbox)
2. I am 18 years old or older. (checkbox)
3. My main web browser is Google Chrome. (checkbox)
4. My main search engine is Google Search. (checkbox)
5. I have read the above information and consent to participate. (checkbox)
6. Please enter your 24 character Prolific ID. (free text)
Demographics
1. What’s your age?
• 18 – 24
• 25 – 34
• 35 – 44
• 45 – 54
• 55 – 64
• 65 – 74
• 75 – 84
• 85 or older
2. What’s your gender identity?
• Woman
• Man
• Non-binary/third gender
• Prefer not to say
3. What’s your race and/or ethnicity? Select all that apply:
• American Indian or Alaska Native
• Black or African American
• Hispanic or Latino
• Indian Subcontinent
• Middle Eastern or North African
• Native Hawaiian or Pacific Islander
• Southeast Asian or East Asian
• White
42
PDF Page 43
Draft
• Other/Not listed
4. What’s your level of education?
• Less than high school
• High school graduate
• Some college
• Bachelor’s degree
• Master’s degree or higher
5. What’s your annual household income before taxes?
• Less than $25,000
• $25,000 – $49,999
• $50,000 – $99,999
• $100,000 – $199,999
• $200,000 or more
6. What’s your political party identification?
• Strong Democrat
• Not very strong Democrat
• Lean Democrat
• Independent
• Lean Republican
• Not very strong Republican
• Strong Republican
7. What is your 5 digit zip code? (free text)
S7.2 Pre-Experiment Survey
1. How familiar are you with LLM applications such as ChatGPT, Claude, and Gemini?
• Not familiar at all
• Slightly familiar
• Somewhat familiar
• Moderately familiar
• Very familiar
• Highly familiar
• Extremely familiar
2. How often do you use LLM applications such as ChatGPT, Claude, and Gemini?
• Never
• At least once per month
43
PDF Page 44
Draft
• At least once per week
• At least once per day
• Multiple times per day
3. Overall, how do you feel about LLM applications such as ChatGPT, Claude, and Gemini?
• Negative
• Somewhat negative
• Neutral
• Somewhat positive
• Positive
4. When you search on Google, how believable is the information you find?
• Not at all
• Slightly
• Somewhat
• Moderately
• Very
• Highly
• Extremely
5. When you search on Google, how trustworthy is the information you find? (same 7-point scale as above)
6. When you search on Google, how accurate is the information you find? (same 7-point scale as above)
7. When you search on Google, how biased is the information you find? (same 7-point scale as above)
8. When you search on Google, how complete is the information you find? (same 7-point scale as above)
9. Please select ‘Slightly’ for this question. (attention check; same 7-point scale as above)
10. I have agency over the information-seeking process on Google.
• Strongly disagree
• Disagree
• Somewhat disagree
• Neither agree nor disagree
• Somewhat agree
• Agree
• Strongly agree
44
PDF Page 45
Draft
11. Information-seeking on Google leads to results that are personalized and relevant to me. (same 7-point agreement scale as above)
12. In general, information-seeking on Google is: (9 semantic differential items, 5-point scale, no intermediate labels)
• Useless – Useful
• Unpleasant – Pleasant
• Bad – Good
• Annoying – Nice
• Ineffective – Effective
• Irritating – Likeable
• Worthless – Helpful
• Undesirable – Desirable
• Sleep-inducing – Stimulating
S7.3 Post-Experiment Survey
1. (For each head-to-head comparison sample, response order randomized as Response A/B)
(a) Which of the two responses do you prefer?
(b) Which of the two responses do you find more trustworthy?
(c) Why did you find Response A more trustworthy? (free text)
2. What was your overall impression of Google’s AI Mode after one week of using it? (AI Mode participants only; free text)
3. Over the last 7 days, how believable was the information you found searching on Google?
• Not at all
• Slightly
• Somewhat
• Moderately
• Very
• Highly
• Extremely
4. Over the last 7 days, how trustworthy was the information you found searching on Google? (same 7-point scale as above)
5. Over the last 7 days, how accurate was the information you found searching on Google? (same 7-point scale as above)
6. Over the last 7 days, how biased was the information you found searching on Google? (same 7-point scale as above)
7. Over the last 7 days, how complete was the information you found searching on Google? (same 7-point scale as above)
45
PDF Page 46
Draft
8. Over the last 7 days, I had agency over the information-seeking process on Google.
• Strongly disagree
• Disagree
• Somewhat disagree
• Neither agree nor disagree
• Somewhat agree
• Agree
• Strongly agree
9. Over the last 7 days, information-seeking on Google led to results that were personalized and relevant to me. (same 7-point agreement scale as above)
10. In general, information-seeking on Google is: (9 semantic differential items, 5-point scale, no intermediate labels)
• Useless – Useful
• Unpleasant – Pleasant
• Bad – Good
• Annoying – Nice
• Ineffective – Effective
• Irritating – Likeable
• Worthless – Helpful
• Undesirable – Desirable
• Sleep-inducing – Stimulating
11. If your search experience from the last 7 days remained permanent, how likely would you be to switch to Bing?
• Extremely unlikely
• Unlikely
• Somewhat unlikely
• Neither likely nor unlikely
• Somewhat likely
• Likely
• Extremely likely
12. Did you search on a browser other than this one in the past week?
• Yes
• No
46