PDF Page 1
A Quadrillion Research Report
The 2026 State of AI Traffic & Cyberthreat Benchmark Report
AI, Agents, Bots, and the New Threat Landscape

PDF Page 2
2 | The 2026 State of AI Traffic & Cyberthreat Benchmark Report
The 2026 State of AI Traffic & Cyberthreat Benchmark Report
Table of Contents
1
Executive Summary 3
2
Methodology 5
The State of AI Traffic: How AI-Driven Automation is Reshaping the Internet 7
3
4
Attack Trends and Cyberthreat Benchmarks 15
5
Industry Trends 25
6
Dark Web Prices for Accounts 39
7
The Trust Challenge Ahead 42
8
About HUMAN Cyberfraud Defense 43
9
Glossary 45
TABLE OF CONTENTS
PDF Page 3
3 | The 2026 State of AI Traffic & Cyberthreat Benchmark Report
Key findings:
• Automated traffic grew 8x faster than human traffic, year over year.
• Monthly volumes of AI-driven traffic grew 187% from January to December 2025, nearly tripling over the calendar year.
• Traffic from AI agents and agentic browsers grew 7,851% year over year.
• More than 95% of AI-driven traffic in 2025 was concentrated in three industries: retail and e-commerce, streaming and media, and travel and hospitality.
• The median percentage of traffic attempting a scraping attack is approaching 20% globally in 2025, nearly double the rate in 2022.
• Post-login account compromise attempts more than quadrupled year over year, with HUMAN flagging an average of 402,000 per organization.
In 2025, the Human Defense Platform processed more than one quadrillion interactions across its global customer base. Our researchers analyzed that data to surface a fundamental shift in how the internet operates: automated traffic — all non-human internet traffic — is growing eight times faster than human traffic, AI-driven traffic — traffic generated by or on behalf of AI systems — is the fastest-growing category of internet traffic, and for the first time, AI systems are not just reading the web but transacting on it.
Executive Summary
EXECUTIVE SUMMARY 1.
PDF Page 4
4 | The 2026 State of AI Traffic & Cyberthreat Benchmark Report EXECUTIVE SUMMARY
AI-driven traffic is exploding, and the automation creating it is diversifying
The monthly volume of AI-driven traffic nearly tripled over the course of 2025. Training crawlers make up the majority at 67.5% of AI-driven traffic, but their share declined sharply throughout the year as traffic from AI scrapers grew 597%, and agentic AI traffic grew 7,851%.
AI traffic is highly concentrated across industries and operators
Three industries absorbed more than 95% of AI-driven traffic in 2025: retail and e-commerce, streaming and media, and travel and hospitality. These are the verticals where structured, frequently updated data has the highest commercial value to AI products,
and where AI products promise the most utility to end users.
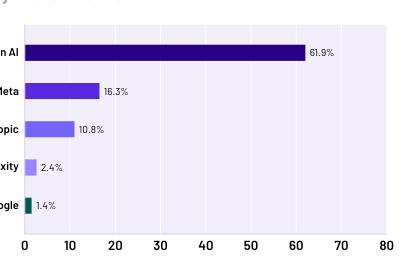
On the operator side, OpenAI generated approximately 69% of all observed AI bot traffic in 2025. Meta accounted for roughly 16%, Anthropic roughly 11%, and everyone else collectively less than 5%.
AI agents are starting to transact
The most structurally significant development in this year’s data is the emergence of agentic AI. Unlike crawlers and scrapers, which read the web,
AI agents and agentic browsers interact with it.
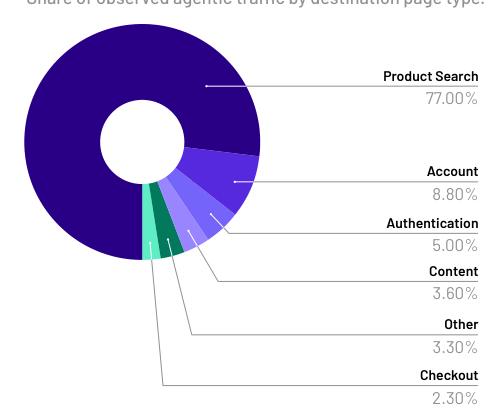
In 2025, 77% of agentic AI activity was on product and search pages, while 8.8% occurred on account pages, 5% on authentication flows, and 2.3% on checkout pages.
Agentic traffic offers retailers a high-converting new channel, as businesses accessible to agents capture demand that others miss. However, autonomous transactions introduce unique security risks and fraud surfaces that differ qualitatively from simple information retrieval.
Threat actors are targeting the same digital surfaces that AI interacts with
The interactions that AI agents are reshaping: product discovery, account management, and checkout, are the same interactions that threat actors target most. For a typical organization, nearly one in five site visits was a scraping attempt in 2025, nearly double the rate in 2022. Post-login account compromise more than quadrupled, with HUMAN flagging an average of 402,000 attempts per organization. Carding volume has surged 250% since 2022.
Defining trust for the agentic internet
The rise of agentic commerce changes what suspicious activity looks like. An AI agent rapidly browsing products and completing a checkout may
be a consumer’s shopping assistant or an automated fraud operation. The behavior is the same. The intent is not. Across all interactions analyzed by the Human Defense Platform, only one half of one percent separates the rate of benign automation from the rate of malicious automation. The old binary of ‘ bot or not’ no longer holds. Organizations need the ability to understand the intent behind every interaction and apply trust dynamically, from first visit to final transaction. The agentic internet is here, and the need for trust infrastructure that operates at its speed and scale is immediate.
PDF Page 5
5 | The 2026 State of AI Traffic & Cyberthreat Benchmark Report
The data in this report is derived from interactions observed by the Human Defense Platform across HUMAN’s customer base from 2022 to 2025. All data is aggregated and anonymized. The customers represented in this dataset are a subset of the full set of organizations protected by the Human Defense Platform.
Scale
HUMAN Sightline analyzed more than one quadrillion interactions in 2025. This dataset encompasses both human and automated traffic, including AI-driven traffic (training crawlers, real-time AI scrapers, and agentic AI) and cyberfraud activity (account takeover, carding, web scraping, and fake account creation attacks).
Statistical measures
This report uses two primary benchmarks to characterize attack activity:
• The “typical HUMAN customer” represents the median value across the dataset.
• The “heavily-targeted HUMAN customer” represents the 90th percentile value. These two measures were selected to reduce the impact of outliers and to provide an accurate representation of the trends observed.
Geographic attribution
References to EMEA and the United States in attack reporting reflect the geographic origin that the traffic identifies itself as coming from, not necessarily the physical location of the threat actor. Threat actors routinely use proxies, VPNs, and distributed infrastructure to route traffic through regions that differ from their physical location.
AI traffic classification
AI-driven traffic is categorized into three types based on characteristics, observed behavior, and declared identity:
• Training crawlers: Automated systems that collect data in bulk for machine learning model development.
• AI scrapers: Systems that extract specific, timely information to feed real-time AI features, including retrieval-augmented generation pipelines, AI-powered search products, and dynamic comparison tools.
• Agentic AI: Autonomous systems that interact with websites by navigating pages, completing forms, and executing transactions.
Operator identification relies on user-agent strings and infrastructure signals, though the reliability of self-declared identity is a known limitation addressed in this report.
2. Methodology
METHODOLOGY
PDF Page 6
6 | The 2026 State of AI Traffic & Cyberthreat Benchmark Report METHODOLOGY
Year-over-year comparisons
Growth rates and trend comparisons reference the same calendar-year methodology applied consistently across reporting periods. Where the report references multi-year trends (e.g., 2022 through 2025), the underlying methodology has remained consistent across those periods.
Threat Tracker data
Unique threat profile counts cited in this report are derived from HUMAN’s Threat Tracker capability within HUMAN Sightline Cyberfraud Defense, which identifies and tracks distinct threats across the customer base. Threat Tracker identified more than three-quarters of a million distinct threat profiles used in attacks in 2025.
Satori Threat Intelligence
Qualitative findings attributed to the Satori Threat Intelligence team are based on our threat research investigations and are cited with links to published analyses.
Limitations
This report reflects traffic observed by the Human Defense Platform and does not represent the totality of internet traffic.

PDF Page 7
7 | The 2026 State of AI Traffic & Cyberthreat Benchmark Report
Automated traffic is outpacing human traffic
In 2025, automated traffic across the internet grew 23.51% year over year — growing roughly eight times faster than human traffic, which increased 3.10% over the same period.
The composition of that growth has also changed. Traditional bots remain a fixture, but AI-driven automation emerged as the dominant growth vector in 2025. Monthly volumes of AI-driven traffic grew 187% from January to December 2025. More than 95% of AI-driven traffic is concentrated within three verticals: retail & e-commerce, streaming & media, and travel & hospitality.
A note on terminology: This report uses “automated traffic” to refer to all non-human internet traffic, and “AI-driven traffic” to refer specifically to the subset generated by or on behalf of AI systems. Full definitions appear in the Glossary.
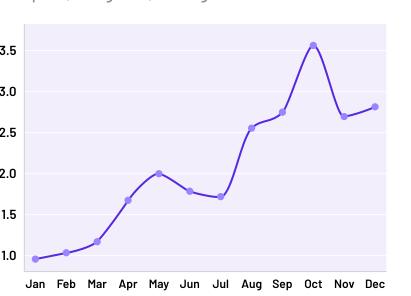
How AI-driven traffic tripled over twelve months
The growth was not linear. Total AI-driven traffic nearly quadrupled between January and October, peaking at 3.61x January’s volume before settling into a plateau for the final two months. Retail and media verticals accounted for more than 80% of the increase, with e-commerce alone driving roughly half.
3. The State of AI Traffic: How AI-Driven Automation is Reshaping the Internet
THE STATE OF AI TRAFFIC: HOW AI-DRIVEN AUTOMATION IS RESHAPING THE INTERNET
Figure 1: Monthly rate of AI-driven automation, January – December 2025.
AI-Driven Traffic By Month
Indexed to January, 2025. Includes training crawlers, scrapers, AI agents, and agentic browsers.
3.5
3.0
2.5
2.0
1.5
1.0
MONTH
May Jun Jul Apr Mar Feb Aug Jan Sep Oct Nov Dec
PDF Page 8
8 | The 2026 State of AI Traffic & Cyberthreat Benchmark Report
AI-driven automation is diversifying
In January 2025, training crawlers accounted for roughly 90% of all observed AI-driven traffic, with real-time scrapers making up the remaining 10%. By December, training crawlers had declined to 74% of the total, scrapers represented 24%, and the newly emerged agentic category — AI agents and agentic browsers — accounted for 1.7%. That last figure is small in share but notable in trajectory.
Who’s driving AI automation: the operator landscape
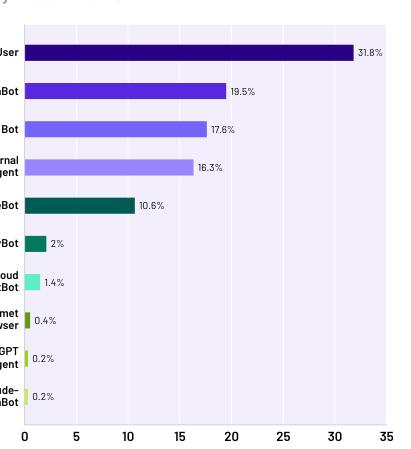
The operator concentration is striking. OpenAI’s bots — ChatGPT User, OAI-SearchBot, GPTBot, and ChatGPT Agent
— account for approximately 69% of all observed AI-driven traffic by volume. Meta-ExternalAgent contributes an additional 16%, and Anthropic identities (ClaudeBot and Claude-SearchBot) roughly 11%. The remaining dozens of identified bots collectively represent less than 5% of total volume. This means that access policy decisions about a handful of AI companies have outsized effects on an organization’s overall exposure to AI-driven traffic.
THE STATE OF AI TRAFFIC: HOW AI-DRIVEN AUTOMATION IS RESHAPING THE INTERNET
AI-Driven Traffic By User Agent
Top user agents by share of observed AI-driven traffic, January–December 2025.
10 15 5 20 25 30 35
ChartGPT User
OAI SearchBot
GPT Bot
Meta-External
Agent
ClaudeBot
PerplexityBot
Google-Cloud
VertexBot
Comet Browser
ChartGPT
Agent
ClaudeSearchBot
PERCENTAGE
0
31.8%
19.5%
17.6%
16.3%
10.6%
2%
1.4%
0.4%
0.2%
0.2%
Figure 2: Percent of AI-driven automation in 2025 by user agent.
Figure 3: Percent of AI-driven automation in 2025 by user operator.
AI-Driven Traffic By Operator
Top five operators by share of observed AI-driven traffic, January–December 2025.
20 30 10 40 50 70 60 80
Open AI
Meta
Anthropic
Perplexity
61.9%
16.3%
10.8%
2.4%
1.4%
PERCENTAGE
0
PDF Page 9
9 | The 2026 State of AI Traffic & Cyberthreat Benchmark Report
AI training crawlers, also known as LLM crawlers, collect data from websites to build or refine machine learning models. Unlike search engine crawlers, which index content for retrieval, training crawlers extract it. Training crawlers typically self-identify through useragent strings like GPTBot, ClaudeBot, and Bytespider, though the reliability of that self-identification is a growing concern.
Training crawlers made up the largest component of AI-driven traffic at approximately 67.5% of all observed AI bot volume in 2025. Their dominance reflects the ongoing demand for training data from both established and emerging AI companies.
Training crawler traffic more than doubled in 2025
AI training crawler volume grew 136% from January to December 2025. Growth concentrated in the second half, with August through October seeing the steepest increases and October marking the peak. E-commerce and travel verticals drove approximately 85% of the total increase, reflecting the high value of structured commercial data as training inputs for models that increasingly power agentic commerce.
The timing is notable: between November 17 and December 11, four major AI companies released frontier models in rapid succession (xAI’s Grok 4.1, Google’s Gemini 3, Anthropic’s Claude Opus 4.5, and OpenAI’s GPT-5.2). October’s crawling surge is consistent with a pre-release data acquisition cycle, suggesting that training crawler volume may increasingly move in anticipation of model release schedules.
Training crawler traffic is highly concentrated in E-commerce
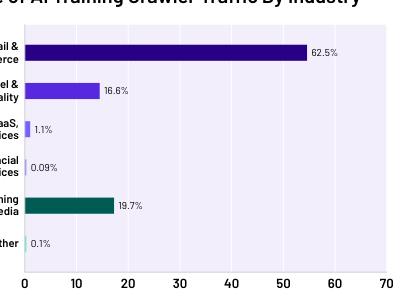
Examining the vertical breakdown, we see that retail and e-commerce sites are the most crawled category by a wide margin, making up 62.5% of all training crawler traffic. This reflects the commercial incentive structure around AI-powered shopping assistants and product recommendations, where model quality depends directly on the freshness and breadth of catalog data.
Media (19.70%) and travel (16.60%) round out a top three that together account for over 98% of training crawler volume.
THE STATE OF AI TRAFFIC: HOW AI-DRIVEN AUTOMATION IS RESHAPING THE INTERNET
Share of AI Training Crawler Traffic By Industry
20 30 10 40 50 60 70
Retail & E-commerce
Travel & Hospitality
Tech, SaaS,
& Services
Financial
Services
Streaming
& Media
Other
PERCENTAGE
0
62.5%
16.6%
1.1%
0.09%
19.7%
0.1%
Figure 4: AI training crawler traffic by vertical, 2025.
AI Training Crawlers
PDF Page 10
10 | The 2026 State of AI Traffic & Cyberthreat Benchmark Report THE STATE OF AI TRAFFIC: HOW AI-DRIVEN AUTOMATION IS RESHAPING THE INTERNET
AI crawler spoofing: How attackers masquerade as ChatGPT, Mistral, and Perplexity
Not all crawlers are what they claim to be. HUMAN’s Satori threat intelligence team analyzed the declared identities of AI training crawlers against behavioral and infrastructure signals and found that a significant portion of requests claiming to be ChatGPT, Mistral, and Perplexity bots did not originate from those operators’ infrastructure. Attackers spoof user-agent strings to exploit the trust organizations extend to recognized AI crawlers, bypassing robots.txt allowlists and rate-limit exemptions.
Organizations that whitelist crawler traffic based solely on user-agent strings are granting access to an unknown number of unauthorized actors. Effective crawler management requires behavioral validation beyond declared identity. Read more >
The concentration of AI crawler traffic mirrors the sectors most affected by malicious scraping, increasing the difficulty of distinguishing between legitimate model-driven automation and hostile data extraction. This overlap is important because it directly affects how organizations build and enforce their access policies.

PDF Page 11
11 | The 2026 State of AI Traffic & Cyberthreat Benchmark Report
AI scrapers differ from training crawlers in both purpose and tempo. Where training crawlers accumulate data in bulk for model development, scrapers extract specific, timely information to feed real-time AI features: live pricing, current inventory, breaking news summaries, and competitive intelligence. They serve the inference layer of AI products — retrieval-augmented generation, real-time search enhancements, and dynamic comparison tools that depend on fresh data with every query.
Scrapers represent 31.9% of all observed AI bot traffic, the second-largest category after training crawlers.
AI Scraper traffic up 7x in 2025
AI scraper traffic grew 597% from January to December. At its October peak, volume reached 12x the January baseline. Media, travel, and e-commerce drove 97% of the total increase — the verticals where information changes fastest and where AI products promise users the most value through real-time freshness.
The acceleration is structural: each time a user queries an AI assistant that grounds its answers in live web data, that query generates scraper traffic. As these products gained users throughout 2025, the compounding effect was significant.
Seasonal factors reinforced the trend: the holiday shopping season intensified demand for real-time pricing data across retail and travel.
AI scrapers target publishers for real-time updates
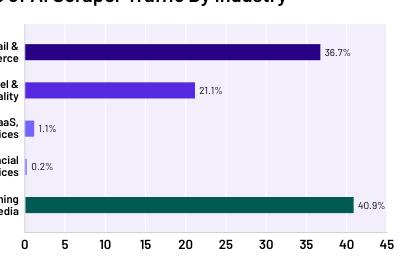
The vertical distribution for scrapers inverts the training crawler pattern: media leads at 40.90%, compared to retail’s 36.70%. This inversion reflects the use case. AI-powered search and news summarization products need a constant stream of freshly published content, making media the primary target. Retail and travel follow, and the combined top three account for 98.70% of all AI scraper traffic.
THE STATE OF AI TRAFFIC: HOW AI-DRIVEN AUTOMATION IS RESHAPING THE INTERNET
Share of AI Scraper Traffic By Industry
10 20 15 5 30 25 40 35 45
Retail & E-commerce
Travel & Hospitality
Tech, SaaS,
& Services
Financial
Services
Streaming
& Media
PERCENTAGE
0
36.7%
21.1%
1.1%
0.2%
40.9%
Figure 5: AI Scraper traffic by vertical, 2025.
AI Scrapers
PDF Page 12
12 | The 2026 State of AI Traffic & Cyberthreat Benchmark Report
Agentic AI represents the most structurally novel category in this year’s data. Where crawlers and scrapers are best understood as automation built to serve AI systems, agents are AI systems that perform the automation themselves. They navigate pages, fill forms, compare products, initiate transactions, and manage account workflows. This category encompasses two distinct form factors: agentic browsers (like ChatGPT Atlas and Perplexity Comet, which embed AI agent capabilities into a full browsing environment) and general-purpose AI agents (like ChatGPT Agent and OpenClaw, which operate autonomously across applications and services on behalf of users).
From niche experiment to measurable traffic
Agentic AI traffic grew 7,851% year over year. Context is important: 2024 volumes started from a very low base, so the multiplier reflects rapid early-stage adoption. But the absolute volume by year-end was significant enough to register across major digital properties.
The growth curve followed the broader AI-traffic pattern — moderate in the first half, sharply accelerating through Q3 and Q4 — but with an even steeper inflection, corresponding to the release of multiple agentic products and browser integrations. Within the category, agentic browsers grew faster than purpose-built agents, roughly doubling agent traffic by late Q4.
Agents are transacting, not just browsing
The behavioral breakdown of agentic traffic reveals a system oriented primarily around commerce:
Product and search pages dominate at 77%. Account pages (8.82%) and authentication flows (4.95%) indicate that agents are operating within logged-in sessions on behalf of users. The 2.31% checkout share is small in relative terms but significant in kind — agents completing checkout flows represent autonomous transaction execution without direct human involvement. This behavior was largely theoretical before 2025. The data confirms it is now operational.
THE STATE OF AI TRAFFIC: HOW AI-DRIVEN AUTOMATION IS RESHAPING THE INTERNET
Agentic AI
77.00%
Product Search
8.80%
Account
5.00%
Authentication
3.60%
Content
3.30%
Other
2.30%
Checkout
Agentic AI Traffic By Page Category
Share of observed agentic traffic by destination page type.
Figure 6: Agentic traffic by page category, 2025.
PDF Page 13
13 | The 2026 State of AI Traffic & Cyberthreat Benchmark Report
Agentic traffic concentrates in commerce, but spreads more broadly than other AI traffic
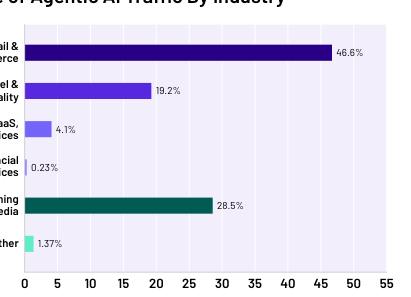
Retail & E-commerce leads agentic traffic at 46.6%, followed by Streaming & Media at 28.5% and Travel & Hospitality at 19.2%. Together, the top three account for 94.3% of agentic traffic — but the distribution is notably more even than for crawlers or scrapers.
However, the two form factors behave differently. Agentic browsers concentrate heavily in e-commerce (55.8% of browser traffic), while purpose-built agents skew toward travel (38.4% of agent traffic). These browsers tend to handle general shopping and product browsing.
Tech/SaaS at 4.10% is notably higher for agentic traffic than for crawlers (1.10%) or scrapers (0.80%), suggesting agents are being used for product evaluation, trial sign-ups, or integration testing — tasks involving form completion and account creation, not just data retrieval.
THE STATE OF AI TRAFFIC: HOW AI-DRIVEN AUTOMATION IS RESHAPING THE INTERNET
How autonomous agents can drive abuse at scale
The abuse potential of agentic AI is already manifesting. Satori analyzed traffic from publicly exposed OpenClaw gateways and found patterns spanning routine automation to clear abuse. Instances were observed generating synthetic referral traffic, systematically tagging requests with fabricated social media UTM parameters to simulate organic engagement at scale. Others conducted automated reconnaissance, including high-velocity directory brute-forcing against web applications. Researchers also documented infostealer malware adapted to target OpenClaw environments, exfiltrating configuration secrets including API keys and agent identity data. Agentic tools like OpenClaw lower the skill threshold for internet fraud, enabling users with no security expertise to conduct attacks that previously required hands-on technical knowledge. Read more >
Share of Agentic AI Traffic By Industry
20 15 30 25 10 5 40 35 55 45 50
Retail & E-commerce
Travel & Hospitality
Tech, SaaS,
& Services
Financial
Services
Streaming
& Media
Other
PERCENTAGE
0
46.6%
19.2%
4.1%
0.23%
28.5%
1.37%
Figure 7: Agentic traffic by vertical, 2025.
PDF Page 14
14 | The 2026 State of AI Traffic & Cyberthreat Benchmark Report
Three patterns define the current landscape. AI-driven traffic is concentrated by vertical (95%+ in retail, media, and travel), by operator (OpenAI alone generates ~69%), and by category (training crawlers at 67.5%, though declining). Each carries implications: a small number of industries bear a disproportionate governance burden, access decisions about a handful of companies determine the vast majority of an organization’s AI-driven traffic profile, and the declining category concentration signals that the composition of AI-driven traffic is growing more complex. More automated actors, with more varied behaviors, across a wider range of site functions.
But classifying this traffic is harder than it looks. Declared identity is unreliable: as the spoofing research earlier in this chapter shows, a significant portion of traffic claiming to be known AI crawlers originates from entirely different operators. The same company can operate across all three categories simultaneously, meaning operator-level access decisions don’t map cleanly to behavioral distinctions. And the same traffic patterns that represent legitimate AI-driven commerce can also represent abuse.
An agent browsing product pages, accessing an account, and completing a checkout could be acting
on behalf of a real customer or executing a carding attack autonomously. The distinction depends on behavioral context, not declared identity.
What makes 2025’s data distinct is the emergence of AI systems that participate in commerce, not just observe it. Agents that create accounts, manage sessions, and complete transactions are taking actions that carry financial and contractual weight. Managing this traffic requires more than detection and blocking. It requires understanding which agents are operating, what they are doing, and whether their actions align with the organization’s policies and risk tolerance.
The growth of AI-driven traffic creates opportunity and risk in equal measure. The same categories of digital interaction that AI agents and scrapers are reshaping — product discovery, account management, checkout, content access — are also the targets of the attack activity documented in the following section. The connection is not always causal, but it is structural: as more commercial activity moves through automated channels, the surface available to threat actors expands with it.
THE STATE OF AI TRAFFIC: HOW AI-DRIVEN AUTOMATION IS RESHAPING THE INTERNET
What AI-Driven Traffic Tells Us About the Future of the Internet
PDF Page 15
15 | The 2026 State of AI Traffic & Cyberthreat Benchmark Report ATTACK TRENDS AND CYBERTHREAT BENCHMARKS
Independent of the AI-driven traffic patterns described above, the Human Defense Platform protects organizations from cyberthreats of four distinct types:
• Account takeover (ATO) attacks
• Carding attacks
• Web scraping attacks
• Fake account creation attacks
Each of these attack categories includes a variety of targets and tactics, and incorporates automation into one stage or another of their kill chain.
This section of the report examines patterns in these attacks from a high level, exploring how rates of attacks have shifted over 2025, over the past four years, and what it looks like for an organization to be heavily targeted by threat actors.
4. Attack Trends and Cyberthreat Benchmarks
Account Takeover Attacks
Carding Attacks
Web Scraping Attacks
Fake Account Creation Attacks


PDF Page 16
16 | The 2026 State of AI Traffic & Cyberthreat Benchmark Report
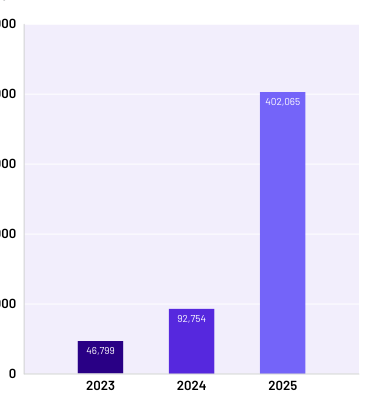
Account takeover (ATO) is one of the most common — and profitable — attack paths for threat actors. Most account takeover attacks start with compromised credentials sourced from data breaches, tested across login portals through credential stuffing or brute forcing. But the technique growing fastest is post-login account compromise, in which attackers abuse session tokens, manipulate account settings, or exploit weak step-up controls to maintain access after a legitimate login. In 2024, HUMAN flagged nearly 100,000 post-login compromise attempts per customer. In 2025, that number more than quadrupled to an average of 402,000.
ATTACK TRENDS AND CYBERTHREAT BENCHMARKS
Account Takeover Attacks
Key findings:
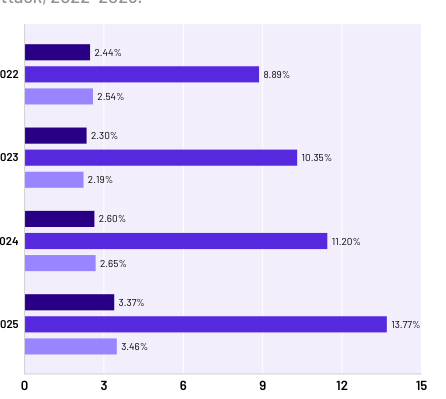
• Shifting geography and context: While overall ATO volume fell more than 30%, the percentage of login traffic attempting an ATO saw its biggest jump in years, particularly from EMEA, where it exceeded 13% (compared to less than 3.5% globally).
• Tactical evolution to post-login compromise: Attacks focused on post-login account compromise more than quadrupled, with HUMAN flagging an average of 402,000 attempts per customer in 2025.
Global Median Attempted ATO Rates
Median percentage of login traffic attempting an ATO attack, 2022–2025.
6 3 12 9 15
2.44%
2022 8.89%
2.54%
2.30%
2023 10.35%
2.19%
2.60%
2024 11.20%
2.65%
3.37%
2025 13.77%
3.46%
PERCENTAGE
0
Global EMEA USA
Figure 8: Global median rates of ATO attempts, 2022-2025.
PDF Page 17
17 | The 2026 State of AI Traffic & Cyberthreat Benchmark Report
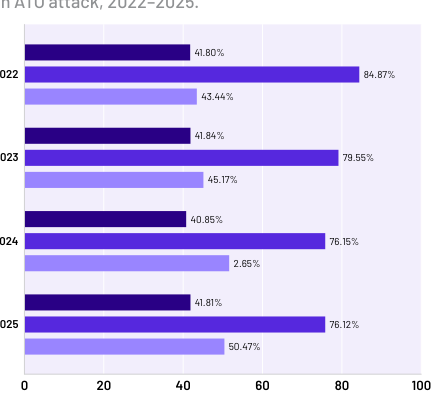
Organizations that are heavily-targeted by threat actors have an even starker jump:
While the global percentage is fairly consistent year over year, the percentage of traffic from EMEA on these heavily-targeted businesses attempting an ATO attack exceeds 75% of login attempts.
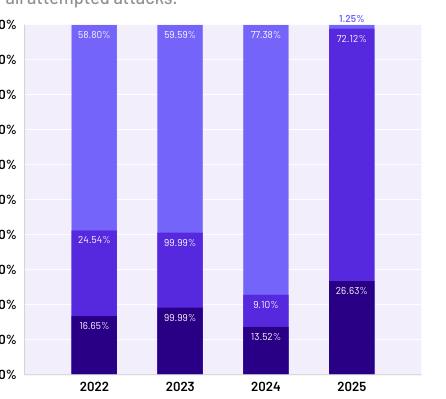
As a percentage of all attempted ATO attacks observed by the Human Defense Platform, the proportion of EMEA-based attacks is clearer still:
ATTACK TRENDS AND CYBERTHREAT BENCHMARKS
Geographic Breakdown of ATO Attempts
Attempted ATO attacks by attack origin, as a proportion of all attempted attacks.
100%
10%
0%
20%
30%
40%
50%
60%
70%
80%
90%
58.80%
24.54%
2022
16.65%
59.59%
99.99%
2023
99.99%
77.38%
9.10%
2024
13.52%
1.25%
72.12%
2025
26.63%
YEAR
EMEA USA Global
Figure 10: Geographic distribution of ATO attacks, based on presented IP, 2022-2025.
Global Heavily-Targeted Attempted ATO Rates
90th Percentile percentage of login traffic attempting an ATO attack, 2022–2025.
40 20 80 60 100
41.80%
2022 84.87%
43.44%
41.84%
2023 79.55%
45.17%
40.85%
2024 76.15%
2.65%
41.81%
2025 76.12%
50.47%
PERCENTAGE
0
Global EMEA USA
Figure 9: Global rates of ATO attempts for heavily-targeted customers, 2022-2025.
PDF Page 18
18 | The 2026 State of AI Traffic & Cyberthreat Benchmark Report
Deposit attacks in online gambling start with ATO
Satori researchers found that “deposit attacks” in online gambling often begin with account takeover (ATO): attackers run large-scale credential stuffing attacks to turn stolen username/password pairs into confirmed logins, then carry out the most damaging activity after login from sessions that appear legitimate. In one “topping and draining” variant, fraudsters use compromised (often dormant) real user accounts — with credentials likely sourced via cracking or dark web credential markets — to log in, make deposits from varied payment sources, and then rapidly withdraw funds to drain balances.
ATTACK TRENDS AND CYBERTHREAT BENCHMARKS
Account takeover attacks in the wild:
In a positive story, one major betting provider saw their attempted ATO percentage decrease significantly from 2024 to 2025. In December 2024, HUMAN blocked more than 163 million ATO attempts. That number decreased steadily over 2025, bottoming out at 1.75 million blocked ATO attempts in August 2025. Their ATO rates have remained low ever since. HUMAN’s customer was protected from these attempts.
Finally, looking specifically at the tactic of post-login account compromise, we can see the scale of the tactical shift threat actors have made in the past year:
The above figures are per customer. These attacks are especially complex to carry out, often requiring more information and a more manual approach than attacks at the point of login. The spike in this particular tactic — as well as the decline in the overall number of attempted ATO attacks — may be indicative of widespread adoption of protections for attacks at the point of login. In order to carry out these lucrative attacks, threat actors have been forced to get more technical and manual.
Finally, HUMAN’s Threat Tracker capability within HUMAN Sightline Cyberfraud Defense identified more than 208,000 unique threat profiles attempting ATO attacks in 2025.
2023
46,799
Post-Login Account Compromise Attacks Per Customer
Volume, per customer, of post-login account compromise ATO attacks, 2023–2025.
100,000
0
200,000
300,000
400,000
500,000
2024
92,754
2025
402,065
YEAR
Figure 11: Post-login account compromise attacks per customer, 2023-2025.
PDF Page 19
19 | The 2026 State of AI Traffic & Cyberthreat Benchmark Report
Carding is card-centric fraud: attackers use automated tools to run small probe transactions, validating stolen payment card details against live checkout flows. Attackers cycle through merchants until they find a checkout that reliably approves their tests, making hardened payment controls the most direct way to reduce exposure.
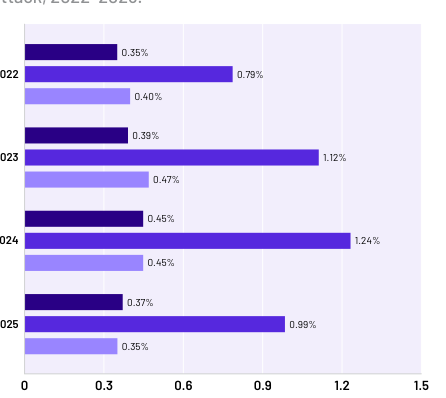
The percentage of checkout traffic attempting a carding attack is fairly stable — and generally fairly low — year over year. In fact, activity percentages are down in the US, in EMEA, and globally:
ATTACK TRENDS AND CYBERTHREAT BENCHMARKS
Carding Attacks
Key findings:
• Substantial volume increases in attempted attacks: While the percentage of checkout traffic attempting a carding attack remained low and stable, the volume of global checkout interactions blocked by the Human Defense Platform increased by more than 20% from 2024 to 2025, and 250% from 2022.
• US as primary activity driver: For the second consecutive year, attempted carding attacks disproportionately came from traffic purporting to be based in the US, making up an outright majority of all attacks stopped.
Global Median Attempted Carding Rates
Median percentage of login traffic attempting a carding attack, 2022–2025.
0.6 0.3 1.2 0.9 1.5
0.35%
2022 0.79%
0.40%
0.39%
2023 1.12%
0.47%
0.45%
2024 1.24%
0.45%
0.37%
2025 0.99%
0.35%
PERCENTAGE
0
Global EMEA USA
Figure 12: Global median carding attack attempts, as a percentage of all checkout traffic, 2022-2025.
PDF Page 20
20 | The 2026 State of AI Traffic & Cyberthreat Benchmark Report
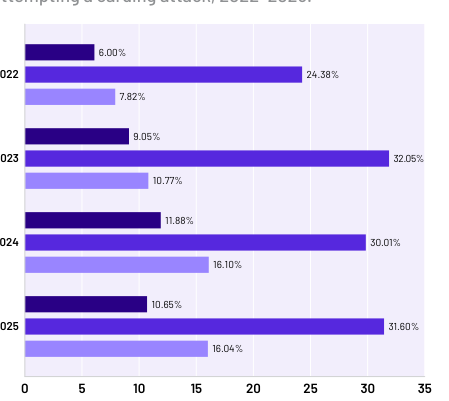
Even the percentage of attempted carding attacks on heavily-targeted organizations is consistent year over year:
Where the numbers shift in a substantial way is the sheer volume of attacks spotted and stopped by the Human Defense Platform. The number of global checkout interactions blocked is up more than 20% from 2024, and up 250% from 2022.
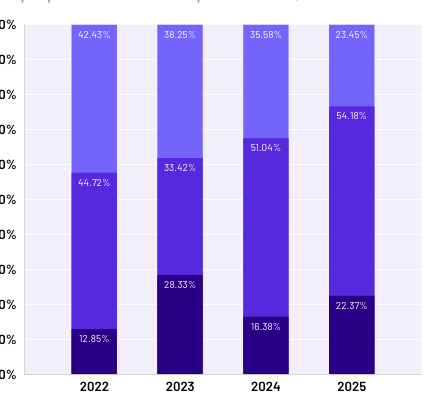
The proportion of carding attacks coming from US-based IP addresses grew from 2024 to 2025:
For the second consecutive year, attempted carding attacks from US-based IP addresses make up an outright majority of all attacks stopped.
Finally, Threat Tracker identified more than 80,000 unique threat profiles attempting a carding attack in 2025.
ATTACK TRENDS AND CYBERTHREAT BENCHMARKS
Geographic Breakdown of Carding Attempts
Attempted carding attacks broken out by geography, as a proportion of all attempted attacks, 2022–2025.
100%
10%
0%
20%
30%
40%
50%
60%
70%
80%
90%
42.43%
44.72%
2022
12.85%
38.25%
33.42%
2023
28.33%
35.58%
51.04%
2024
16.38%
23.45%
54.18%
2025
22.37%
YEAR
EMEA USA Global
Figure 14: Geographic distribution of carding attacks, based on presented IP, 2022-2025.
Global Heavily-Targeted Attempted Carding Rates
90th percentile percentage of checkout traffic attempting a carding attack, 2022–2025.
15 20 5 10 30 25 35
6.00%
2022 24.38%
7.82%
9.05%
2023 32.05%
10.77%
11.88%
2024 30.01%
16.10%
10.65%
2025 31.60%
16.04%
PERCENTAGE
0
Global EMEA USA
Figure 13: Carding attack attempts as a percentage of all checkout traffic for heavily-targeted HUMAN customers, 2022-2025.
PDF Page 21
21 | The 2026 State of AI Traffic & Cyberthreat Benchmark Report
AI agents are already being used in cardinglike attacks
Satori researchers observed a carding-like “checking” pattern mediated by an AI agent, in which the threat actor rapidly cycled through multiple credit-card additions and repeated payment-completion attempts to see which card would authorize. The sequence included 11 card-add attempts and 6 payment attempts across two sessions, followed by a pivot to loyaltypoint redemption after the card paths failed, mirroring established carding workflows, but executed through an AI browser agent.
Researchers described how AI agents can be useful tools for threat actors in light of their speed, hybrid human/automated sessions, and ability to operate within authenticated sessions.
ATTACK TRENDS AND CYBERTHREAT BENCHMARKS
Carding attacks in the wild:
An international e-commerce company saw its rate of attempted carding attacks triple from July to August of 2025. That rate then tripled again early in 2026. HUMAN’s customer was — and is — protected from this attack.

PDF Page 22
22 | The 2026 State of AI Traffic & Cyberthreat Benchmark Report
Web scraping attacks use automation and scale to extract large volumes of data from websites — pricing, product catalogs, proprietary content — often quickly enough to look harmless at first glance. The business damage ranges from direct content theft and competitive undercutting to inflated infrastructure costs and paywall circumvention.
Scraping attacks have been growing in both volume and as a percentage of traffic for the last several years:
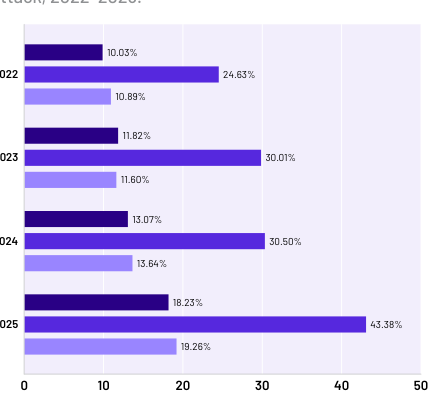
Globally, the median percentage of traffic attempting a scraping attack was just a shade over 10% in 2022. By 2025, that percentage was approaching 20%. And that’s the median value; consider that half of the customers protected by HUMAN from scraping attacks see percentages even higher than these. The global volume of attempted scraping attacks is up almost 47% from last year, and up 138% since 2022.
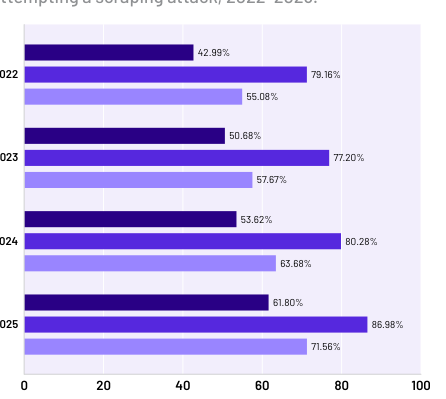
By 2023, the percentage of traffic attempting a scraping attack on heavily-targeted companies reached an outright majority. Since then, that percentage has continued to climb and now exceeds 61% of traffic.
ATTACK TRENDS AND CYBERTHREAT BENCHMARKS
Web Scraping Attacks
Key findings:
• Volume and rate both climb: The global volume of attempted attacks increased by almost 47% from 2024 and 138% from 2022. The median global percentage of traffic attempting a scraping attack nearly doubled from 2022 to 2025, approaching 20%.
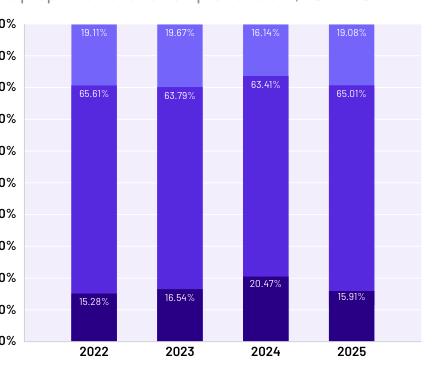
• Geographic disparity: Despite the extremely high percentages in EMEA-based activity, America remains the origin of the most scraping activity, accounting for almost two-thirds of all scraping attacks blocked by the Human Defense Platform in 2025.
Global Median Attempted Scraping Rates
Median percentage of traffic attempting a scraping attack, 2022–2025.
20 10 40 30 50
10.03%
2022 24.63%
10.89%
11.82%
2023 30.01%
11.60%
13.07%
2024 30.50%
13.64%
18.23%
2025 43.38%
19.26%
PERCENTAGE
0
Global EMEA USA
Figure 15: Global median scraping attack percentages, 2022-2025.
PDF Page 23
23 | The 2026 State of AI Traffic & Cyberthreat Benchmark Report
The geographic breakdown of attempted scraping attacks paints an even starker picture. Of EMEA-based activity, the median percentage exceeds 43% of traffic, and heavily-targeted businesses saw a whopping 87% of traffic attempting a scraping attack. Nonetheless, American threat actors make up the bulk of attacks, accounting for almost two-thirds of all attacks blocked by the Human Defense Platform in 2025:
The continued growth in scraping attack volumes and percentages coincides with the rise of AI crawlers and scrapers. Consider: of the entire universe of interactions analyzed by the Human Defense platform, only one half of one percent separates the rate of benign automation from the rate of malicious automation. Automation is growing, for both good and ill, and scraping is one of the key tasks asked of these bots and agents.
Finally, the Threat Tracker capability within HUMAN Sightline Cyberfraud Defense identified more than 476,000 unique threat profiles attempting a scraping attack in 2025. That’s 62% of all of the threat profiles identified.
ATTACK TRENDS AND CYBERTHREAT BENCHMARKS
Geographic Breakdown of Scraping Attempts
Attempted scraping attacks broken out by geography, as a proportion of all attempted attacks, 2022–2025.
100%
10%
0%
20%
30%
40%
50%
60%
70%
80%
90%
19.11%
65.61%
2022
15.28%
19.67%
63.79%
2023
16.54%
16.14%
63.41%
2024
20.47%
19.08%
65.01%
2025
YEAR
EMEA USA Global
15.91%
Figure 17: Geographic distribution of scraping attacks, based on presented IP, 2026.
Web Scraping attacks in the wild:
One pharmaceutical company with an e-commerce business is heavily targeted by threat actors for scraping attacks, to the tune of 30-40% of their web traffic on average. In October and November of 2025, those rates ballooned up to over 70% of their traffic before falling again in December and into 2026. HUMAN’s customer was protected from this attack.
Global Heavily-Targeted Attempted Scraping Rates
90th percentile percentage of checkout traffic attempting a scraping attack, 2022–2025.
60 80 20 40 100
42.99%
2022 79.16%
55.08%
50.68%
2023 77.20%
57.67%
53.62%
2024 80.28%
63.68%
61.80%
2025 86.98%
71.56%
PERCENTAGE
0
Global EMEA USA
Figure 16: Global heavily-targeted scraping attack percentages, 2022–2025.
PDF Page 24
24 | The 2026 State of AI Traffic & Cyberthreat Benchmark Report
Fake account creation uses automation and stolen or synthetic identity data to generate accounts that look legitimate on the surface. Attackers age these accounts with realistic activity before activating them for incentive abuse, fraudulent orders, fake reviews, or as infrastructure for downstream fraud.
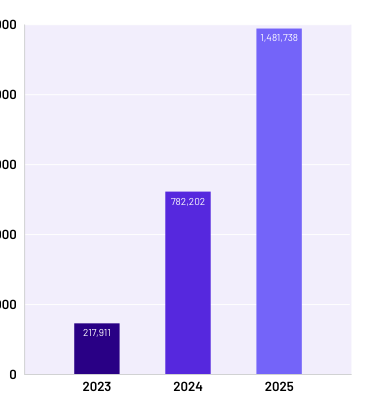
The number of fake account attacks flagged by the Human Defense Platform continues to grow steadily.
That’s a 259% growth in the number of flagged accounts between 2023 and 2024, and an additional 89% from 2024 to 2025. Fake accounts remain an especially attractive tactic for threat actors, particularly when there are new account incentives in place.
Fake accounts power large-scale streaming fraud
Satori researchers described how large-scale streaming fraud operations rely on fake accounts (and sometimes account takeover) to generate “authentic-looking” engagement — streams, likes, comments, and clicks — at scale, helping bot-driven activity blend in with real listeners. Fraudsters also use AI to automate identity spoofing and rotate proxies/VPNs, simulating geographically diverse, human-like listeners and making these fake accounts harder for streaming platforms to detect.
ATTACK TRENDS AND CYBERTHREAT BENCHMARKS
Fake Account Creation Attacks
Key findings:
• Significant growth in attack volume: The overall volume of fake account creation attempts continues to grow dramatically, increasing by 259% from 2023 to 2024, and by an additional 89% in 2025.
• Tactic of choice for incentive abuse: Fake account creation remains a highly attractive tactic for threat actors, particularly when organizations offer incentives for new users, leading to the rapid draining of promotional budgets and serving as a precursor to other forms of fraud.
2023
217,911
Fake Accounts Detected Per Customer
Volume, per customer, of fake accounts detected, 2023–2025.
300,000
0
600,000
900,000
1,200,000
1,500,000
2024
782,202
2025
1,481,738
YEAR
Figure 18: Global volume of fake accounts detected per customer, 2023-2025.
Fake account attacks in the wild:
Incentives for new users often precede fake account creation; one major betting provider saw 874,000 fake accounts created over the course of 2025, a total a little higher than half the average number per HUMAN customer. HUMAN detected all of these fake accounts and mitigated any actions they tried to take.
PDF Page 25
25 | The 2026 State of AI Traffic & Cyberthreat Benchmark Report
Retail & E-commerce
INDUSTRY TRENDS
The Human Defense Platform protects a broad mix of organizations, from airlines and online sports betting platforms to major retailers, SaaS providers, and media outlets. Because every business operates differently, the threats they face vary widely. For the purposes of this report, we group customers into five industries:
For the purposes of this report, we group customers into five industries:
• Retail & E-commerce
• Travel & Hospitality
• Streaming & Media
• Financial Services
• Technology, SaaS, & Services
When attacks stop working against one target, threat actors face a choice: change the tactic (expensive, requires development time) or change the target (cheaper, faster). If shifting the attack to another business starts producing results again, that’s the answer almost every time. The shifts in attack distribution across these industries over the past four years capture that decision-making process.
We examine these shifts from three angles. First, the distribution of attacks across industries, revealing year-by-year shifts in which verticals hold the greatest value to threat actors. Second, the evolution of attack rates within each industry, exploring both the typical HUMAN customer (represented by the
median) and the heavily-targeted HUMAN customer (the 90th percentile). These trends can serve as a leading indicator of where threat actors are aiming.
Finally, dark web pricing for compromised accounts provides an effective lagging indicator: when prices rise, protections are working and accounts are harder to come by; when they fall, attackers have found a way in.
5. Industry Trends
Travel & Hospitality
Financial Services
Streaming & Media
Technology, SaaS, & Services


PDF Page 26
26 | The 2026 State of AI Traffic & Cyberthreat Benchmark Report
16.60%
Retail & E-commerce
10.95%
Travel & Hospitality
63.77%
Streaming & Media
7.63%
Tech, SaaS, & Services
0.74%
Financial Services
0.31%
Other
2024
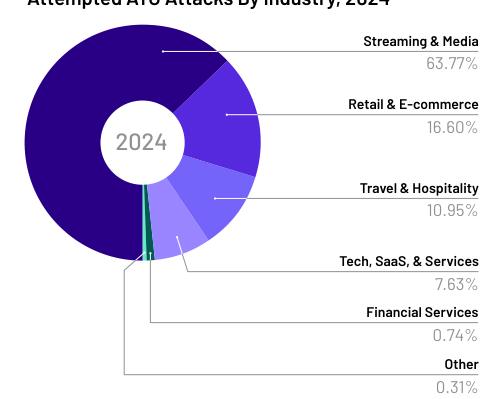
Attempted ATO Attacks By Industry, 2024
Figure 21: Percentage of ATO attacks attempted by industry, 2024.
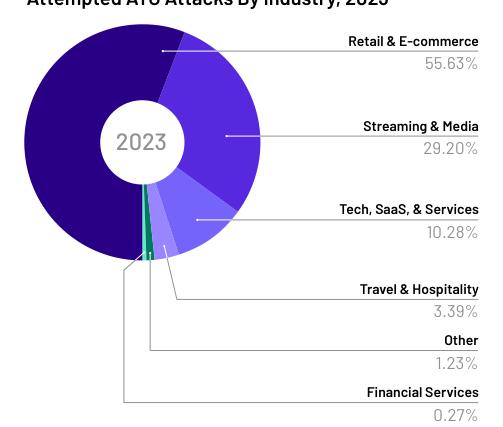
Attack distribution by industry
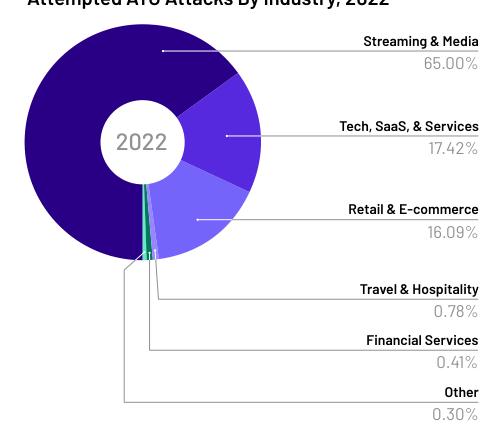
The swings in shares of attacks analyzed by the Human Defense Platform over the last four years capture attacker’s decision-making process. When the share of attacks in one industry shifts dramatically from one year to the next, that reflects either external forces necessitating a change (like increased demand for hacked accounts in a particular industry) or internal forces (the attacks aren’t working where they used to).
INDUSTRY TRENDS
17.42%
Tech, SaaS, & Services
16.09%
Retail & E-commerce
65.00%
Streaming & Media
0.78%
Travel & Hospitality
0.41%
Financial Services
0.30%
Other
2022
Attempted ATO Attacks By Industry, 2022
Figure 19: Percentage of ATO attacks attempted by industry, 2022.
29.20%
Streaming & Media
10.28%
Tech, SaaS, & Services
55.63%
Retail & E-commerce
3.39%
Travel & Hospitality
1.23%
Other
0.27%
Financial Services
2023
Attempted ATO Attacks By Industry, 2023
Figure 20: Percentage of ATO attacks attempted by industry, 2023.
13.94%
Tech, SaaS, & Services
13.55%
Other
54.92%
Retail & E-commerce
8.63%
Travel & Hospitality
8.56%
Streaming & Media
0.40%
Financial Services
2025
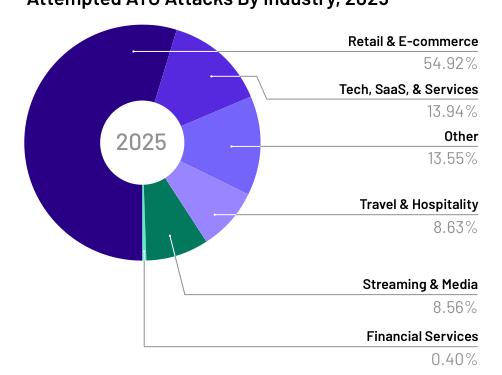
Attempted ATO Attacks By Industry, 2025
Figure 22: Percentage of ATO attacks attempted by industry, 2025.
There’s significant volatility in ATO attack targeting since 2022, with threat actors pinging back and forth between focusing on streaming & media businesses and retail & e-commerce. 2025 was a retail & e-commerce year, along with a resurgence in attacks centering on tech, SaaS, & services businesses.
PDF Page 27
27 | The 2026 State of AI Traffic & Cyberthreat Benchmark Report
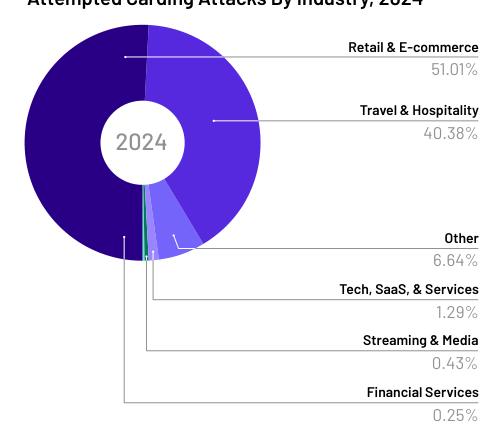
6.64%
Other
40.38%
Travel & Hospitality
51.01%
Retail & E-commerce
1.29%
Tech, SaaS, & Services
0.43%
Streaming & Media
0.25%
Financial Services
2024
Attempted Carding Attacks By Industry, 2024
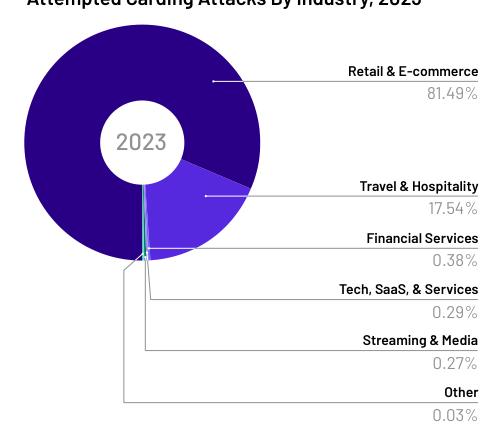
Figure 25: Attempted carding attacks by industry, 2024.
17.54%
Travel & Hospitality
0.38%
Financial Services
81.49%
Retail & E-commerce
0.29%
Tech, SaaS, & Services
0.27%
Streaming & Media
0.03%
Other
2023
Attempted Carding Attacks By Industry, 2023
Figure 24: Attempted carding attacks by industry, 2023.
INDUSTRY TRENDS
2.82%
Streaming & Media
2.11%
Travel & Hospitality
93.80%
Retail & E-commerce
0.73%
Financial Services
0.43%
Tech, SaaS, & Services
0 11%
Other
2022
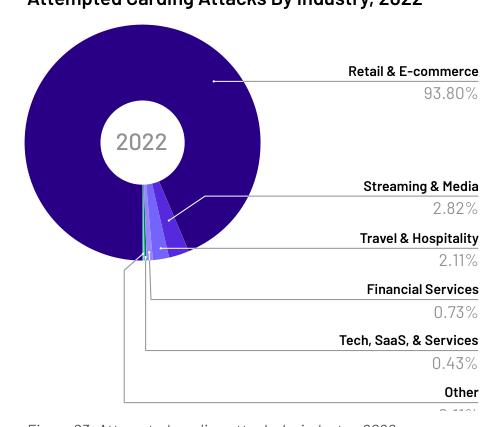
Attempted Carding Attacks By Industry, 2022
Figure 23: Attempted carding attacks by industry, 2022.
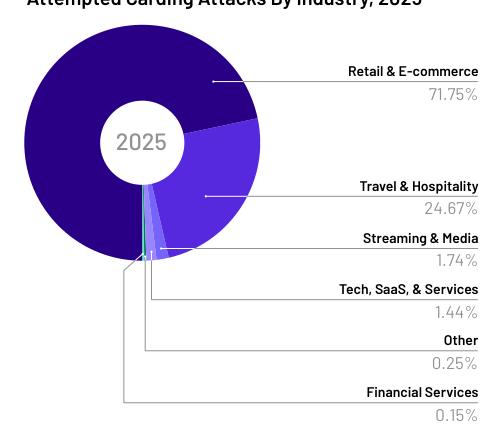
24.67%
Travel & Hospitality
1.74%
Streaming & Media
71.75%
Retail & E-commerce
1.44%
Tech, SaaS, & Services
0.25%
Other
0.15%
Financial Services
2025
Attempted Carding Attacks By Industry, 2025
Figure 26: Attempted carding attacks by industry, 2025.
In contrast, retail & e-commerce businesses have been the target of an outright majority of carding attacks for the fourth year running. Also of note, the share of carding attacks targeting technology, SaaS, & services businesses, while still a small percentage of the overall carding attack universe, has grown steadily over the past four years. That share has tripled since 2022.
PDF Page 28
28 | The 2026 State of AI Traffic & Cyberthreat Benchmark Report
22.04%
Streaming & Media
8.48%
Travel & Hospitality
65.32%
Retail & E-commerce
2.50%
Other
1.58%
Tech, SaaS, & Services
0.08%
Financial Services
2024
Attempted Scraping Attacks By Industry, 2024
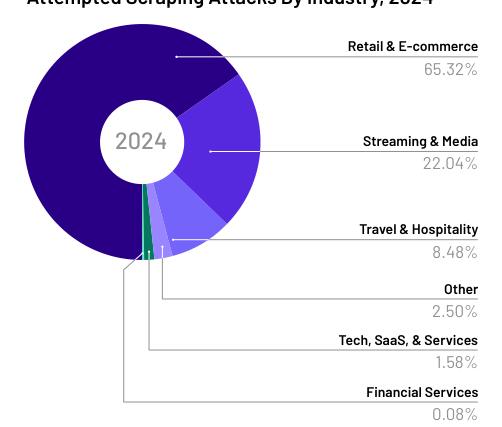
Figure 29: Attempted scraping attacks by industry, 2024.
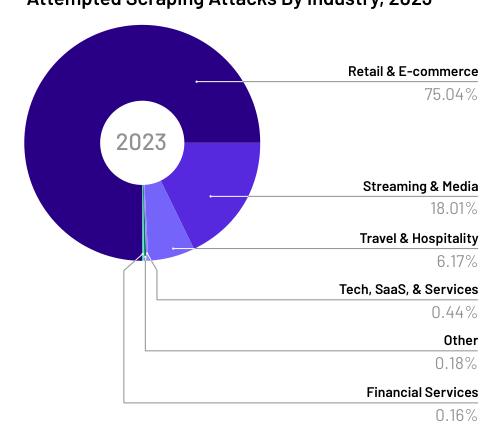
18.01%
Streaming & Media
6.17%
Travel & Hospitality
75.04%
Retail & E-commerce
0.44%
Tech, SaaS, & Services
0.18%
Other
0.16%
Financial Services
2023
Attempted Scraping Attacks By Industry, 2023
Figure 28: Attempted scraping attacks by industry, 2023.
Attack trends by industry
This section examines what percentage of traffic to businesses in these industries was attempting an attack. We explore both the typical HUMAN customer — represented by the median value and charts — and the heavilytargeted HUMAN customer, for which we share the 90th percentile data.
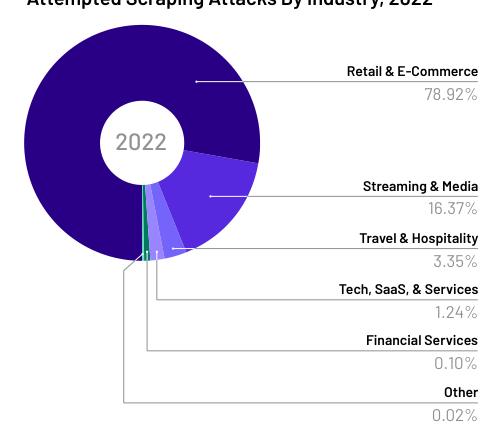
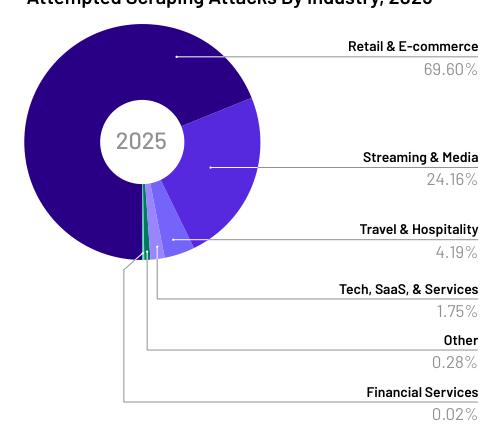
On the scraping front, while retail & e-commerce businesses have held the top share of attacks for the fourth year in a row, threat actors are targeting streaming & media businesses in greater proportion each year.
INDUSTRY TRENDS
16.37%
Streaming & Media
3.35%
Travel & Hospitality
78.92%
Retail & E-Commerce
1.24%
Tech, SaaS, & Services
0.10%
Financial Services
0.02%
Other
2022
Attempted Scraping Attacks By Industry, 2022
Figure 27: Attempted scraping attacks by industry, 2022.
24.16%
Streaming & Media
4.19%
Travel & Hospitality
69.60%
Retail & E-commerce
1.75%
Tech, SaaS, & Services
0.28%
Other
0.02%
Financial Services
2025
Attempted Scraping Attacks By Industry, 2025
Figure 30: Attempted scraping attacks by industry, 2025.
PDF Page 29
29 | The 2026 State of AI Traffic & Cyberthreat Benchmark Report INDUSTRY TRENDS
Retail & E-commerce
Key findings:
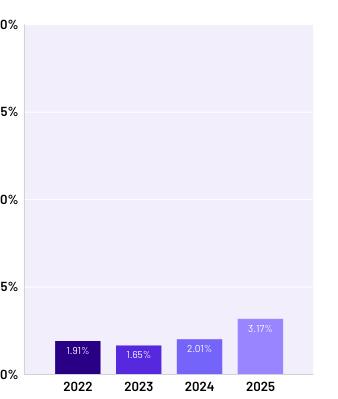
• The overall volume of attempted scraping attacks against retail and e-commerce businesses surpassed 150 billion in 2025, with the percentage of traffic attempting these attacks nearly doubling since 2022.
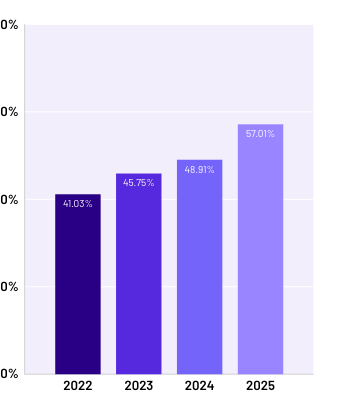
• Heavily-targeted businesses in this sector are experiencing scraping rates in excess of 57% of all traffic to their product pages, a figure that has been steadily increasing.
• One major retailer recorded 9.2 billion attempted scraping attacks in December 2025 alone, illustrating the intense focus of threat actors on this industry.
0%
5%
10%
20%
15%
0%
5%
10%
20%
15%
0%
5%
10%
20%
15%
2023
10.64%
2024
12.18%
2025
17.17%
2022
9.09%
2023
1.65%
2024
2.01%
2025
3.17%
2022
1.91%
2023
0.31%
2024
0.40%
2025
0.39%
2022
0.32%
Median ATO Rates on Retail & E-commerce Businesses
YEAR
Median Carding Rates on Retail & E-commerce Businesses
YEAR
Median Scraping Rates on Retail & E-commerce Businesses
YEAR
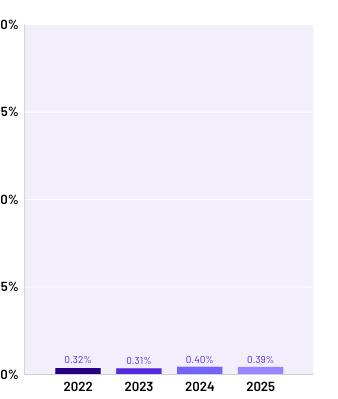
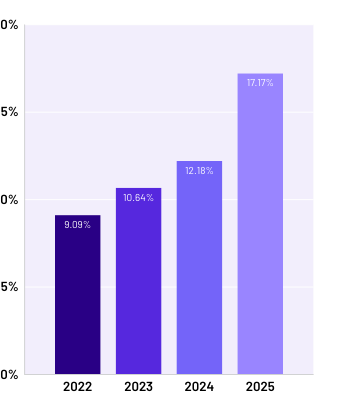
Figure 31: Median ATO attack rates on retail & e-commerce businesses, 2022-2025.
Figure 32: Median Carding attack rates on retail & e-commerce businesses, 2022-2025.
Figure 33: Median Scraping attack rates on retail & e-commerce businesses, 2022-2025.
Threat actors clearly perceive retail & e-commerce businesses as potential targets for scraping attacks. The percentage of traffic attempting a scraping attack has nearly doubled since 2022, and the volume of these attempted attacks exceeded 150 billion in 2025. The percentage of login traffic attempting an ATO attack is small, but growing year over year.
PDF Page 30
30 | The 2026 State of AI Traffic & Cyberthreat Benchmark Report
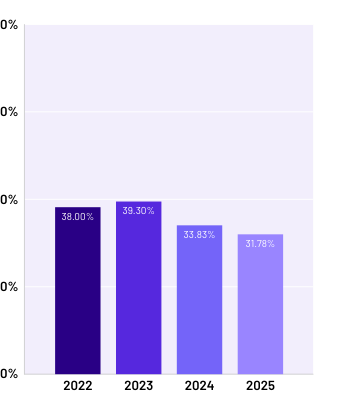
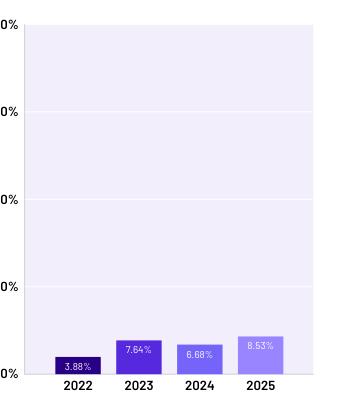
Heavily-targeted businesses in the space are more stable for attempted ATO and carding attacks, but a top target for scrapers:
Heavily-targeted businesses saw scraping rates in excess of 57% of traffic to their product pages, a figure that has been steadily increasing since 2022. Across all threat types, HUMAN’s Threat Tracker identified more than 440,000 distinct threat profiles targeting retail and e-commerce businesses in 2025.
INDUSTRY TRENDS
Protecting retail & e-commerce businesses in the wild:
One major retailer, a top target for web scraping, saw 9.2 billion attempted scraping attacks during December 2025 alone. Threat actors changed tactics frequently during this period, shifting from one scraping attack signature to another several times. HUMAN’s customer was protected from this attack.
0%
20%
40%
80%
60%
0%
20%
40%
80%
60%
0%
20%
40%
80%
60%
ATO Rates on Heavily-Targeted Retail & E-commerce Businesses
YEAR
Carding Rates on Heavily-Targeted Retail & E-commerce Businesses
YEAR
Scraping Rates on Heavily- Targeted Retail & E-commerce Businesses
YEAR
2023
39.30%
2024
33.83%
2025
31.78%
2022
38.00%
2023
7.64%
2024
6.68%
2025
8.53%
2022
3.88%
2023
45.75%
2024
48.91%
2025
57.01%
2022
41.03%
Figure 34: ATO attack rates on heavily-targeted retail & e-commerce businesses, 2022-2025.
Figure 35: Carding attack rates on heavilytargeted retail & e-commerce businesses, 2022-2025.
Figure 36: Scraping attack rates on heavilytargeted retail & e-commerce businesses, 2022-2025.
PDF Page 31
31 | The 2026 State of AI Traffic & Cyberthreat Benchmark Report INDUSTRY TRENDS
Travel & Hospitality
Key findings:
• Attempted attack rates for the typical Travel & Hospitality customer are stable, though stability suggests a consistent level of attack success.
• Heavily-targeted businesses in this sector saw their highest attempted scraping attack rate in years at nearly 48% of traffic to product or listing pages, coupled with a nearly 6x increase in attempted carding attacks since 2022.
Median ATO Rates on Travel & Hospitality Businesses
0%
2%
4%
10%
8%
6%
2023
9.91%
2024
2.87%
2025
1.37%
YEAR
2022
1.19%
0%
Median Carding Rates on Travel & Hospitality Businesses
2%
4%
10%
8%
6%
2023
0.59%
2024
0.45%
2025
0.35%
YEAR
2022
0.16% 0%
Median Scraping Rates on Travel & Hospitality Businesses
2%
4%
10%
8%
6%
2023
4.52%
2024
4.38%
2025
4.78%
YEAR
2022
5.70%
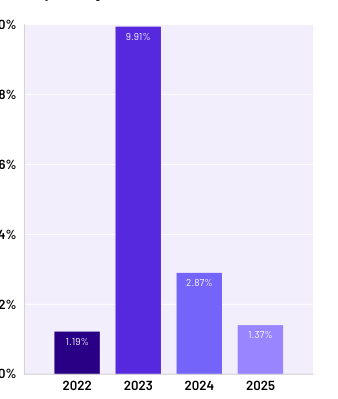
Figure 37: Median ATO attack rates on travel & hospitality businesses, 2022-2025.
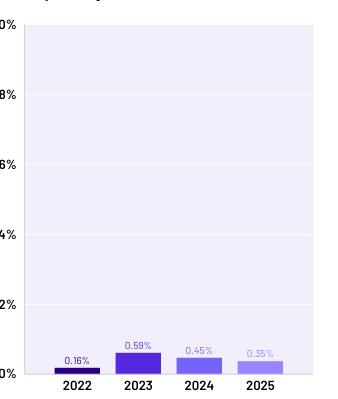
Figure 38: Median Carding attack rates on travel & hospitality businesses, 2022-2025.
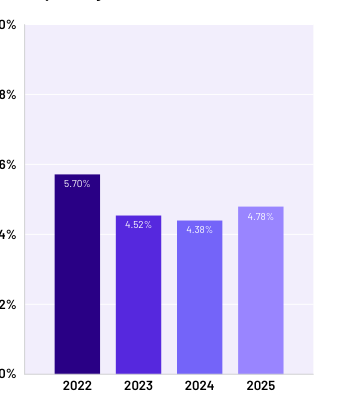
Figure 39: Median Scraping attack rates on travel & hospitality businesses, 2022-2025.
Attempted attack rates for the typical HUMAN customer in the travel and hospitality space are fairly stable year over year, with one significant blip in attempted ATO attacks in 2023. Stability, however, shouldn’t result in complacency. As discussed earlier, a consistent attack rate reflects threat actors’ belief in the value of continuing to target that industry.
PDF Page 32
32 | The 2026 State of AI Traffic & Cyberthreat Benchmark Report
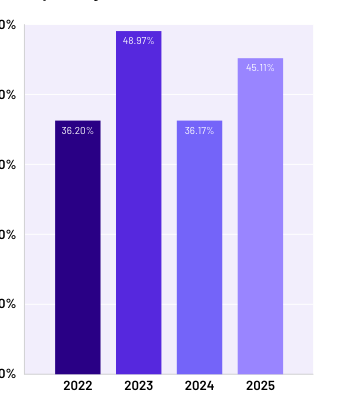
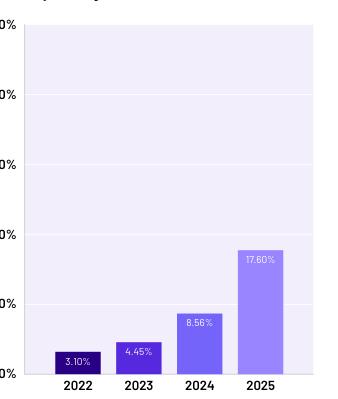
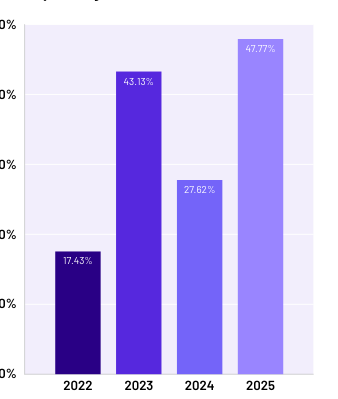
Heavily-targeted travel and hospitality businesses’ attack rates fluctuate year over year, culminating in the highest attempted rate in 2025 at nearly 48% of traffic to product or listing pages. Perhaps of greater concern, however, is the steadily climbing rate of attempted carding attacks. What was only 3% in 2022 has grown nearly 6x and now accounts for more than 17% of checkout traffic.
INDUSTRY TRENDS
Protecting travel & hospitality businesses in the wild:
It may seem intuitive, but attacks on airlines increase when the weather is better. One airline saw its rate of attempted carding attacks climb from less than 1% of transactions early in 2025 to more than 8% of
transactions in the height of the summer, before falling back below 1% by the end of the year. HUMAN’s customer was protected from this attack.
Median ATO Rates on Travel & Hospitality Businesses
0%
10%
20%
50%
40%
30%
YEAR
0%
Median Carding Rates on Travel & Hospitality Businesses
10%
20%
50%
40%
30%
YEAR
0%
Median Scraping Rates on Travel & Hospitality Businesses
10%
20%
50%
40%
30%
YEAR
2023
48.97%
2024
36.17%
2025
45.11%
2022
36.20%
2023
4.45%
2024
8.56%
2025
17.60%
2022
3.10%
2023
43.13%
2024
27.62%
2025
47.77%
2022
17.43%
Figure 40: ATO attack rates on heavily-targeted travel & hospitality businesses, 2022-2025.
Figure 41: Carding attack rates on heavilytargeted travel & hospitality businesses, 2022-2025.
Figure 42: Scraping attack rates on heavilytargeted travel & hospitality businesses, 2022-2025.
PDF Page 33
33 | The 2026 State of AI Traffic & Cyberthreat Benchmark Report
Median ATO Rates on Streaming & Media Businesses
0%
10%
20%
50%
40%
30%
YEAR
0%
Median Carding Rates on Streaming & Media Businesses
10%
20%
50%
40%
30%
YEAR
0%
Median Scraping Rates on Streaming & Media Businesses
10%
20%
50%
40%
30%
YEAR
2023
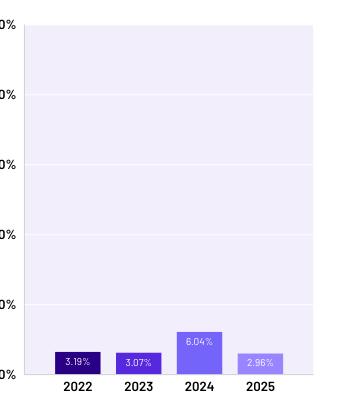
3.07%
2024
6.04%
2025
2.96%
2022
3.19%
2023
0.33%
2024
0.67%
2025
0.57%
2022
0.84%
2023
17.19%
2024
27.18%
2025
37.20%
2022
16.47%
Figure 43: Median ATO attack rates on streaming & media businesses, 2022-2025.
Figure 44: Median carding attack rates on streaming & media businesses, 2022-2025.
Figure 45: Median scraping attack rates on streaming & media businesses, 2022-2025.
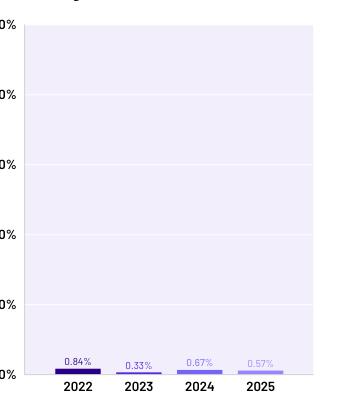
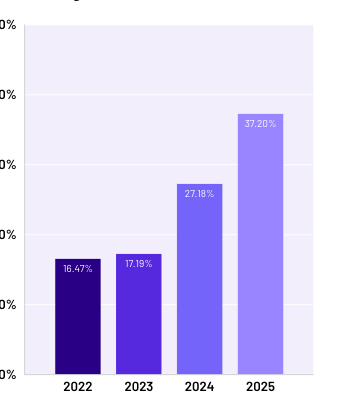
Streaming and media businesses face sector-specific attack patterns, including criminals testing stolen cards via lowcost subscriptions and streaming fraud operations that exploit fake accounts to generate artificial engagement at scale.
INDUSTRY TRENDS
Streaming & Media
Key findings:
• Scraping attacks are rising significantly, with the median attempted attack rate more than doubling since 2022 to over a third of site traffic in 2025.
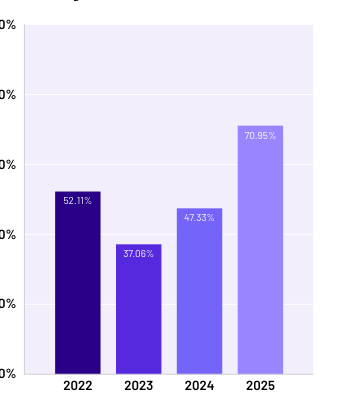
• Heavily-targeted businesses have seen attempted ATO attacks nearly double from 2023, reaching almost 71% of login traffic in 2025.
A reminder: these are the median attempted attack rates. That means half of the HUMAN customer base in this industry has rates even higher than these. In 2025, more than a third of traffic to streaming and media sites was attempting a scraping attack, a number that’s more than double the rate from four years ago and has leapt considerably in the last two years.
PDF Page 34
34 | The 2026 State of AI Traffic & Cyberthreat Benchmark Report
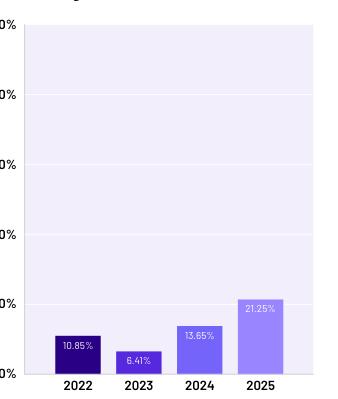
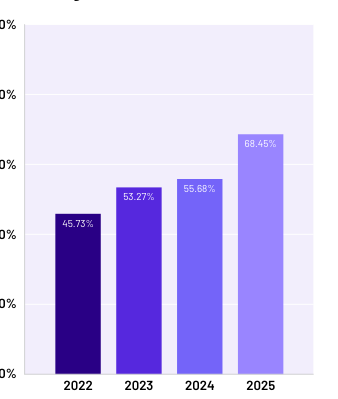
For the heavily-targeted businesses in the space, the jump in attempted ATO attacks is the big story. Two years ago, the rate was 37%, which is high, but was at the time down significantly from 2022. Now, the rate has climbed to almost 71% of login traffic, nearly double the rate from 2023. On top of that, the attempted scraping rate has climbed year over year as well, reaching more than 68% of traffic to these sites.
INDUSTRY TRENDS
Protecting streaming & media businesses in the wild:
One financial news publisher, highly targeted by scraping attacks, hovered just below 50% of web traffic attempting a scraping attack throughout 2025. By February 2026, that rate had climbed to almost two-thirds of web traffic attempting an attack. HUMAN’s customer was protected from this attack.
ATO Rates on Heavily-Targeted Streaming & Media Businesses
0%
10%
20%
50%
40%
30%
YEAR
0%
Carding Rates on Heavily-Targeted Streaming & Media Businesses
10%
20%
50%
40%
30%
YEAR
0%
Scraping Rates on Heavily-Targeted Streaming & Media Businesses
10%
20%
50%
40%
30%
YEAR
2023
53.27%
2024
55.68%
2025
68.45%
2022
45.73%
2023
6.41%
2024
13.65%
2025
21.25%
2022
10.85%
2023
37.06%
2024
47.33%
2025
70.95%
2022
52.11%
Figure 46: ATO attack rates on heavily-targeted streaming & media businesses, 2022-2025.
Figure 47: Carding attack rates on heavilytargeted streaming & media businesses, 2022-2025.
Figure 48: Scraping attack rates on heavilytargeted streaming & media businesses, 2022-2025.
PDF Page 35
35 | The 2026 State of AI Traffic & Cyberthreat Benchmark Report
Financial services organizations sit closest to stored value and high-trust customer data, making them frequent targets for ATO. Compromised financial accounts are especially valuable because they can be paired with stolen credentials to other services, extending the cashout window.
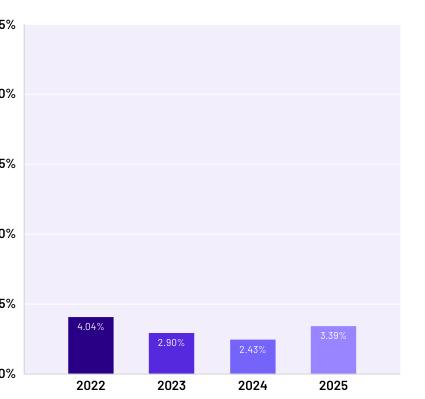
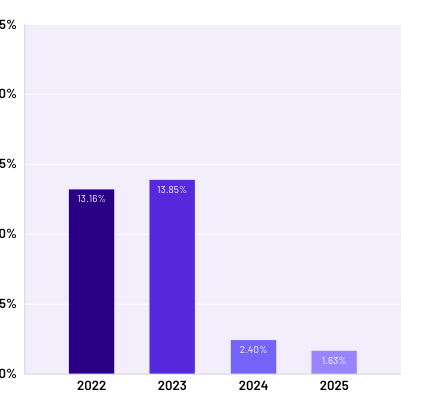
Attempted ATO rates on financial services businesses remained consistent and low, while the attempted scraping rates that took a major tumble in 2024 continued to decline year over year.
INDUSTRY TRENDS
Financial Services
Key findings:
• Attempted ATO attack rates on financial services businesses increased by 39% year over year.
• Heavily-targeted financial services businesses experienced ATO attacks at a rate of over one-third of login traffic, while attempted scraping attacks accounted for more than a quarter of total traffic.
25%
Median ATO Attack Rates on Financial Services Businesses
0%
5%
10%
15%
20%
2023
2.90%
2024
2.43%
2025
3.39%
YEAR
2022
4.04%
Figure 49: Median ATO attack rates on financial services businesses, 2022-2025.
25%
Median Scraping Attack Rates on Financial Services Businesses
0%
5%
10%
15%
20%
2023
13.85%
2024
2.40%
2025
1.63%
YEAR
2022
13.16%
Figure 50: Median Scraping attack rates on financial services businesses, 2022-2025.
PDF Page 36
36 | The 2026 State of AI Traffic & Cyberthreat Benchmark Report
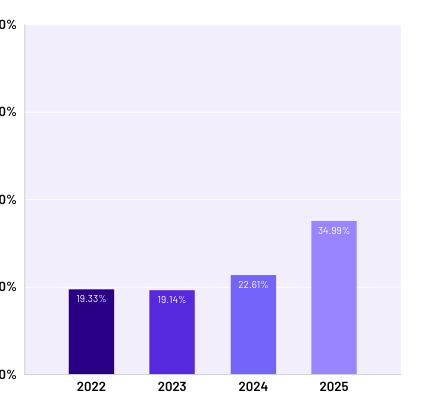
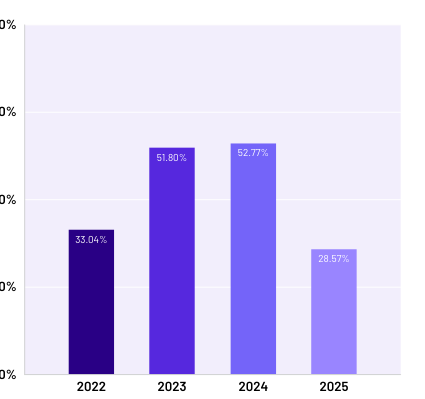
The situation is, naturally, less rosy for the heavily-targeted businesses in the industry. There, more than a third of login traffic is attempting an ATO attack, and attempted scraping attacks, while down from 2024’s high, still account for more than a quarter of traffic.
INDUSTRY TRENDS
80%
ATO Rates on Heavily-Targeted Financial Services Businesses
0%
20%
40%
60%
2023
19.14%
2024
22.61%
2025
34.99%
YEAR
2022
19.33%
Figure 51: Attack rates on heavily-targeted financial services businesses, 2022-2025.
20%
2025
28.57%
0%
80%
60%
40%
Scraping Rates on Heavily-Targeted Financial Services Businesses
YEAR
2023
51.80%
2024
52.77%
2022
33.04%
Figure 52: Attack rates on heavily-targeted financial services businesses, 2022-2025.
Protecting financial services businesses in the wild:
One banking and insurance provider experienced an eight-month-long ATO attack during which 12–15% of traffic logging in was attempting an account takeover. That attack rate dropped in the second half of the year, while the overall login volume remained consistent. HUMAN’s customer was protected from this attack.
PDF Page 37
37 | The 2026 State of AI Traffic & Cyberthreat Benchmark Report
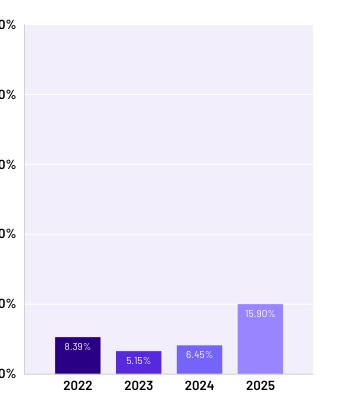
Median ATO Attack Rates on Technology, SaaS, & Services Businesses
0%
10%
20%
50%
40%
30%
YEAR
0%
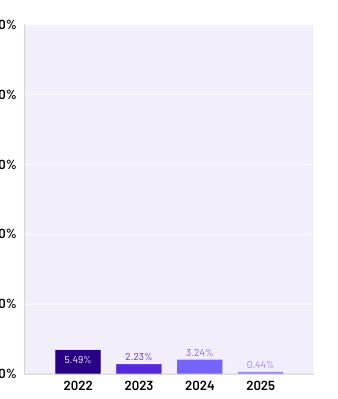
Median Carding Attack Rates on Technology, SaaS, & Services Businesses
10%
20%
50%
40%
30%
YEAR
0%
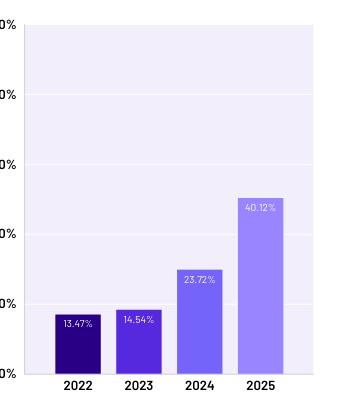
Median Scraping Attack Rates on Technology, SaaS, & Services Businesses
10%
20%
50%
40%
30%
YEAR
2025
15.90%
2023
5.15%
2024
6.45%
2022
8.39%
2025
0.44%
2023
2.23%
2024
3.24%
2022
5.49%
2025
40.12%
2023
14.54%
2024
23.72%
2022
13.47%
Figure 53: Median ATO attack rates on technology, SaaS, & Services businesses, 2022-2025.
Figure 54: Median carding attack rates on technology, SaaS, & Services businesses, 2022-2025.
Figure 55: Median scraping attack rates on technology, SaaS, & Services businesses, 2022–2025.
This category spans many different business models, but we group these organizations together because they share similar delivery and interaction patterns: digital-first, automated sign-up and usage flows. Tech companies with selfserve onboarding, stored payment methods, or high-volume transactions are often particularly exposed to account takeover and transaction abuse.
The median scraping rate exceeds two in every five visits, and the sheer volume is climbing to match. In 2022, the number of scraping attempts on this industry was 1.1 billion. By 2025, that number had grown to 3.7 billion, a massive increase in a short window.
INDUSTRY TRENDS
Technology, SaaS, & Services
Key findings:
• The median attempted scraping rate for Technology, SaaS, & Services businesses exceeded 40% of visits in 2025, and the total volume of scraping attempts has more than tripled since 2022, reaching 3.7 billion.
• Heavily-targeted businesses in this sector saw attempted scraping rates of around two-in-three visits, and attempted ATO attacks constituted the outright majority of logins for the second consecutive year.
PDF Page 38
38 | The 2026 State of AI Traffic & Cyberthreat Benchmark Report
ATO Rates on Heavily-Targeted Technology, SaaS, & Services Businesses
0%
20%
40%
80%
60%
YEAR
0%
Carding Rates on Heavily- Targeted Technology, SaaS, & Services Businesses
20%
40%
80%
60%
YEAR
0%
Scraping Rates on Heavily- Targeted Technology, SaaS, & Services Businesses
20%
40%
80%
60%
YEAR
2025
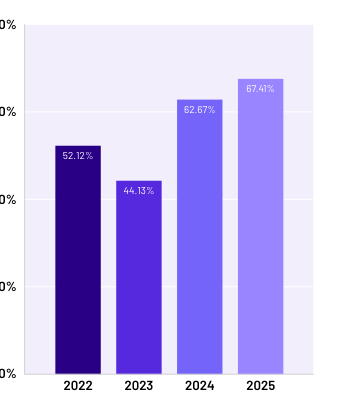
67.41%
2023
44.13%
2024
62.67%
2022
52.12%
2025
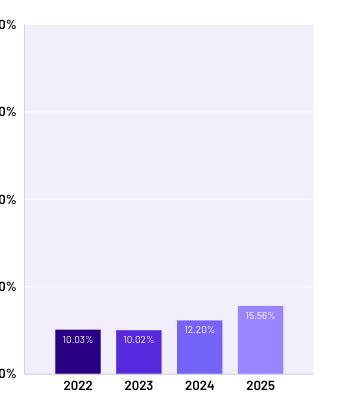
15.56%
2023
10.02%
2024
12.20%
2022
10.03%
2025
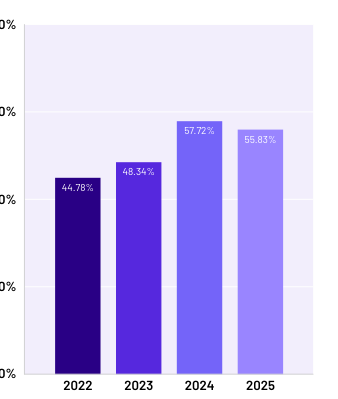
55.83%
2023
48.34%
2024
57.72%
2022
44.78%
Figure 56: ATO rates for heavily-targeted technology, SaaS, & Services businesses, 2022–2025.
Figure 57: Carding rates for heavily-targeted technology, SaaS, & Services businesses, 2022–2025.
Figure 58: Scraping rates for heavily-targeted technology, SaaS, & Services businesses, 2022–2025.
The attempted scraping rate jumps from two-in-five at the median level to two-in-three for the heavily targeted cohort of tech businesses. And for the second consecutive year, attempted ATO attacks make up the outright majority of logins for heavily-targeted tech businesses.
INDUSTRY TRENDS
Protecting technology, SaaS, & services businesses in the wild:
In perhaps a rebuke to the idea of Thanksgiving leftovers, a food delivery service experienced an ATO attack after the holiday to the tune of 57 million fraudulent account login attempts. That made for an 11% attempted ATO rate of all login traffic. By December, the monthlong rate had fallen to its normal level. HUMAN’s customer was protected from this attack.
PDF Page 39
39 | The 2026 State of AI Traffic & Cyberthreat Benchmark Report
Underground markets are shaped by the same basic forces as legitimate ones: supply and demand. Threat actors price their “products” (like compromised or fake accounts, stolen payment credentials, or botnet access) at a level that sustains profit, and those prices naturally reflect how scarce the item is, and how much effort, risk, and technical complexity is required to obtain it. When a particular product becomes more difficult to acquire, prices tend to rise, signaling that defensive controls are increasing attacker cost. When prices fall, it often indicates the opposite: attackers have found easier, cheaper, or more scalable ways to generate supply.
DARK WEB PRICES FOR ACCOUNTS 6. Dark Web Prices for Accounts
Key findings:
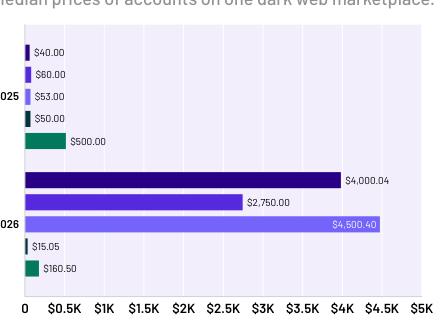
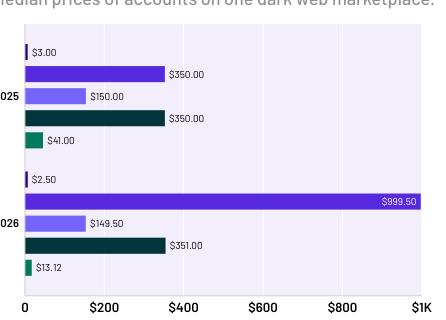
• Financial services and tech accounts are getting harder to steal. Hacked accounts on one crypto exchange now command up to $4,500 on the dark web, up from under $500, and email accounts for one provider nearly tripled to $999.50, signaling that defenses in these categories are raising attacker costs significantly.
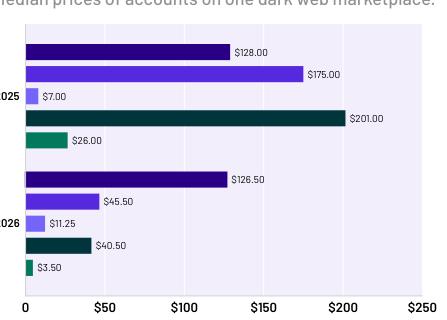
• Travel & hospitality accounts are getting cheaper. One hotel chain’s loyalty program accounts fell from $201 to $40.50, and one national airline’s accounts from $175 to $45.50, suggesting that attackers have found more efficient paths to compromise in this vertical.
• The spread within verticals is widening. In financial services, the gap between the most and least expensive accounts grew from under $500 to more than $4,000. Similar divergence is visible in retail and tech, indicating that security maturity varies dramatically even within the same industry.
PDF Page 40
40 | The 2026 State of AI Traffic & Cyberthreat Benchmark Report
What Do Financial Services Accounts Cost on the Dark Web?
Median prices of accounts on one dark web marketplace.
$2K $1.5K $1K $0.5K $4K $4.5K $3.5K $3K $2.5K $5K
2025
$40.00
$60.00
$53.00
$50.00
$500.00
2026
$4,000.04
$2,750.00
$4,500.40
$15.05
$160.50
0
Crypto Exchange Crypto Exchange Personal Payment Platform Personal Payment Platform Personal Payment Platform
PRICE PER ACCOUNT
Figure 59: Financial services dark web account costs.
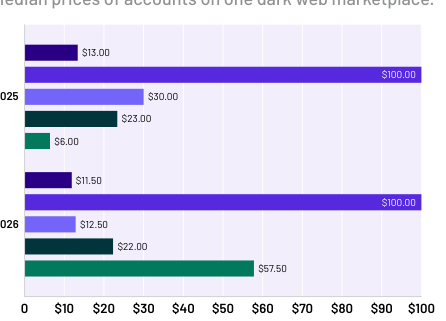
What Do Streaming & Media Accounts Cost on the Dark Web?
Median prices of accounts on one dark web marketplace.
$40 $30 $20 $10 $80 $90 $70 $60 $50 $100
2025
$13.00
$100.00
$30.00
$23.00
$6.00
2026
$11.50
$100.00
$12.50
$22.00
$57.50
PRICE PER ACCOUNT
0
Ticketing Platform Resale Marketplace
Niche Retailer Niche Retailer
Major Retailer
Figure 61: Streaming & media dark web account costs.
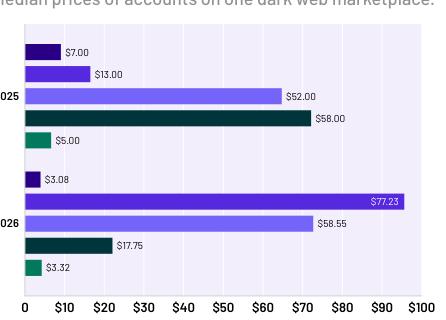
What Do Retail & E-commerce Accounts Cost on the Dark Web?
Median prices of accounts on one dark web marketplace.
$40 $30 $20 $10 $80 $90 $70 $60 $50 $100
2025
$7.00
$13.00
$52.00
$58.00
$5.00
2026
$3.08
$77.23
$58.55
$17.75
$3.32
0
Ticketing Platform Resale Marketplace
Niche Retailer Niche Retailer
Major Retailer
PRICE PER ACCOUNT
Figure 60: Retail & e-commerce dark web account costs.
What Do Travel & Hospitality Accounts Cost on the Dark Web?
Median prices of accounts on one dark web marketplace.
$100 $50 $200 $150 $250
2025
$128.00
$175.00
$7.00
$201.00
$26.00
2026
$126.50
$45.50
$11.25
$40.50
$3.50
PRICE PER ACCOUNT
0
Budget Airline National Airline
Hotel Chain Sports Betting Platform
Fast Food
Figure 62: Travel & hospitality dark web account costs.
DARK WEB PRICES FOR ACCOUNTS
For defenders, tracking dark web pricing for the abuse types most closely tied to their business can provide useful context about the broader threat landscape. While prices are typically a lagging indicator, sustained movement up or down can help corroborate whether security and fraud controls are constraining attacker profitability, or whether attackers are adapting in ways that restore their margins.
PDF Page 41
41 | The 2026 State of AI Traffic & Cyberthreat Benchmark Report DARK WEB PRICES FOR ACCOUNTS
What Do Technology, SaaS, & Services Accounts Cost on the Dark Web?
Median prices of accounts on one dark web marketplace.
$400 $200 $800 $600 $1K
2025
$3.00
$350.00
$350.00
$150.00
$41.00
2026
$2.50
$999.50
$149.50
$351.00
$13.12
PRICE PER ACCOUNT
0
Service Marketplace Email Provider
Rideshare App Food Delivery App
Communications Platform
Figure 63: Technology, SaaS, & services dark web account costs.

PDF Page 42
42 | The 2026 State of AI Traffic & Cyberthreat Benchmark Report THE TRUST CHALLENGE AHEAD 7. The Trust Challenge Ahead
The findings of this report confirm that the internet has reached a critical inflection point: the transition from a human-centric web to one heavily influenced and populated by AI is no longer a future projection, but a current reality.
Three shifts define the 2025 data. AI-driven traffic nearly tripled and is now the fastest-growing category of internet traffic. That traffic is heavily concentrated in a small number of industries and operators. And AI agents and agentic browsers have moved from experimental tools to systems that complete transactions, manage accounts, and execute purchases autonomously.
For organizations, these shifts change what security needs to look like. The old question was binary: is this a bot or not? That framing no longer holds. Behavior that once reliably indicated an attack, such as rapid page navigation, programmatic form completion, and automated checkout, may now be a legitimate agentic commerce workflow. At the same time, threat actors are getting more sophisticated, not less active. Post-login account compromise attempts quadrupled. Carding volume has surged 250% since 2022. Malicious scraping is approaching 20% of all traffic. And across all interactions analyzed by the Human Defense Platform, only one half of one
percent separates the rate of benign automation from the rate of malicious automation. The question is no longer whether traffic is automated. It is whether a given interaction is trustworthy, regardless of whether it comes from a human, an AI agent, or an agentic browser. Organizations that treat all automation as hostile will block revenue. Those that allow it unchecked will absorb fraud. The path between those outcomes requires visibility into every interaction and an understanding of its intent.
Early 2026 data confirms that the momentum has not slowed. AI agent and agentic browser traffic has continued its upward trajectory, and these systems are becoming more deeply embedded in commercial workflows. The concentration of AI-driven traffic among a small number of operators and verticals means that policy decisions made now about how to manage this traffic will shape organizational risk and opportunity for years to come.
The Human Defense Platform will continue to monitor this landscape. Next year’s research will expand our analysis of agentic AI’s impact on commercial workflows and the trust frameworks required to govern them. Our goal remains to provide the intelligence organizations need to operate confidently in an increasingly automated world.
PDF Page 43
43 | The 2026 State of AI Traffic & Cyberthreat Benchmark Report ABOUT HUMAN CYBERFRAUD DEFENSE 8. About HUMAN Cyberfraud Defense
HUMAN’s AgenticTrust builds on HUMAN’s Sightline as the trust and control layer for agentic AI. It turns unknown AI traffic into visible, controllable, and trusted interactions by detecting AI agent actions and intent, verifying their trust level, and governing how agents interact with web applications.
HUMAN’s Sightline Cyberfraud Defense arms your teams with unified, real-time visibility across bots, humans, and AI agents. It’s designed to protect against bot attacks, AI risk, and human fraud across web, mobile, and APIs, so you can enable legitimate, trusted interactions while blocking the rest.
Analyze bot traffic with HUMAN’s Sightline Cyberfraud Defense
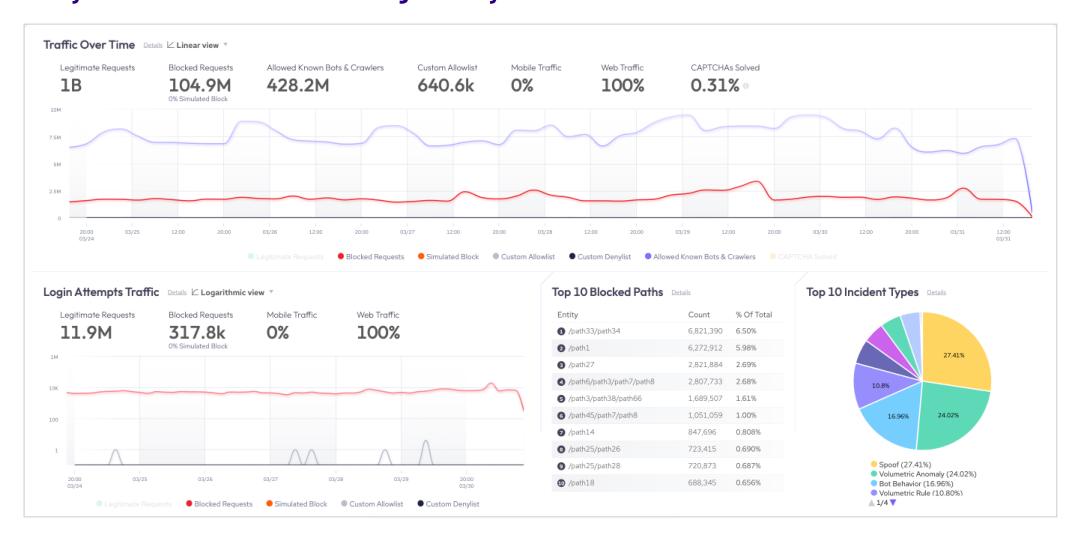
PDF Page 44
44 | The 2026 State of AI Traffic & Cyberthreat Benchmark Report ABOUT HUMAN CYBERFRAUD DEFENSE
Gain visibility into agentic providers, targeted routes & intent with HUMAN’S AgenticTrust
Sightline and AgenticTrust work to provide holistic visibility, governance, and control across bots, humans, and AI agents, so you can safely embrace agentic commerce while reducing fraud and abuse.
Learn more about how HUMAN protects against attacks across your digital channels.
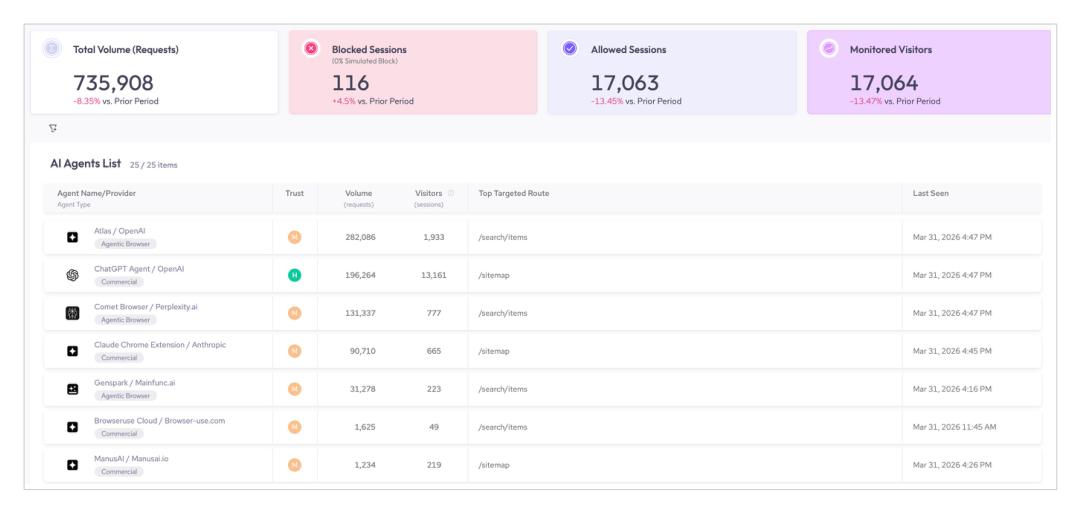

PDF Page 45
45 | The 2026 State of AI Traffic & Cyberthreat Benchmark Report GLOSSARY
Glossary
Account takeover (ATO)
An attack in which a threat actor gains unauthorized access to a legitimate user’s account, typically through credential stuffing, brute forcing, or postlogin compromise. Successful ATOs can be used to drain stored funds, harvest payment information, make fraudulent purchases, or resell access to the compromised account.
Agentic AI
AI systems that plan, decide, and act autonomously to complete multi-step tasks on the web. Unlike crawlers and scrapers, which are automation built to serve AI systems, agentic AI systems perform the automation themselves. This category encompasses both purpose-built AI agents and agentic browsers.
Agentic browser
A browser product that wraps foundation model capabilities around a full browsing session, enabling autonomous web interaction. Examples include OpenAI’s Atlas and Perplexity’s Comet.
Agentic commerce
Commercial activity conducted by AI agents and agentic browsers on behalf of human users, including product discovery, price comparison, account management, and autonomous checkout.
AI agent
A purpose-built AI system designed to complete specific tasks autonomously on the web, such as shopping, booking, or account management. Distinct from agentic browsers in that agents are typically built for narrower, task-specific workflows.
AI-driven traffic
The combined traffic generated by or on behalf of AI systems, encompassing three categories: AI training crawlers, real-time AI scrapers, and agentic AI (AI agents and agentic browsers). Distinct from traditional automation, such as search engine crawlers, monitoring bots, and conventional scraping tools.
AI scraper
An automated system that extracts specific, timely information from websites to feed real-time AI features, including retrieval-augmented generation (RAG) pipelines, AI-powered search products, and dynamic comparison tools. Unlike training crawlers, AI scrapers operate on demand and prioritize data freshness over volume.
9.
PDF Page 46
46 | The 2026 State of AI Traffic & Cyberthreat Benchmark Report
Automated traffic
All internet traffic generated by software systems rather than human users, including traditional automation such as search engine crawlers, monitoring bots, and conventional scraping tools, as well as AI-driven traffic. In 2025, automated traffic grew eight times faster than human traffic. See also: AI-driven traffic.
Benign automation
Automated traffic that serves a legitimate purpose, including search engine crawlers, performance monitoring tools, AI training crawlers that identify themselves and respect access policies, AI scrapers retrieving data on behalf of real user queries, and AI agents completing tasks on behalf of authorized users. Benign automation may still have business
implications, such as content extraction by AI scrapers, even when it is not malicious in intent.
Carding
A technique in which threat actors test stolen payment card details by running small probe transactions on e-commerce sites. Cards that successfully clear a test purchase are then used for larger fraudulent transactions or resold.
Credential stuffing
An attack method in which leaked username and password pairs from data breaches are tested across multiple login portals to find accounts where users have reused the same credentials.
Fake account creation
An abuse pattern in which threat actors use automation and stolen or fabricated identity data to create accounts at scale. These accounts are used for incentive abuse, fraudulent transactions, fake reviews, and as infrastructure for downstream fraud.
Malicious automation
Automated traffic designed to defraud, exploit, or abuse digital systems, including credential stuffing, carding, unauthorized scraping, fake account creation, and other attack types. Malicious automation frequently mimics the behavior of benign automation or human users to evade detection.
Post-login account compromise
A form of account takeover in which attackers gain control of a user’s session after the point of login, typically by abusing session tokens, manipulating account settings, or exploiting weak step-up authentication controls.
Retrieval-augmented generation (RAG)
An AI framework in which a language model supplements its internal knowledge by retrieving realtime information from external sources in response to a user query. AI scrapers are the primary mechanism by which RAG systems collect this external data.
Threat profile
A distinct threat actor identity tracked by HUMAN’s Threat Tracker capability. A single threat profile may be responsible for multiple attacks across multiple targets.
Training crawler
An automated system that traverses websites to collect data in bulk for machine learning model training. Training crawlers typically identify themselves through user-agent strings such as GPTBot, ClaudeBot, or Bytespider, though the reliability of self-identification is a known concern.
Web scraping (malicious)
The automated extraction of data from websites at scale for unauthorized purposes, including competitive intelligence theft, content republication, price undercutting, and paywall circumvention. Distinct from AI scraping in that the intent is typically to exploit or replicate the data rather than to feed an AI system.
GLOSSARY
PDF Page 47
47 | The 2026 State of AI Traffic & Cyberthreat Benchmark Report
About HUMAN
HUMAN Security is the global leader in Agentic Trust, the emerging discipline that informs and governs how humans, bots, and AI agents operate online. For more than a decade, HUMAN has specialized in understanding and mitigating synthetic traffic risk at internet scale, protecting the world’s largest brands, advertising platforms, and commerce networks. Today, HUMAN helps enterprises, platforms, and digital ecosystems verify digital interactions and establish trust across the entire customer journey — from first ad impression to final transaction. Powered by one of the world’s largest behavioral signal networks, HUMAN analyzes over a quadrillion digital interactions each year to distinguish legitimate activity from fraud, abuse, and automated manipulation.
HUMAN delivers a unified trust layer for the agentic era — bridging security, marketing, and media with shared visibility, governance, and confidence in a world where humans and AI agents operate side by side. Learn more at humansecurity.com.